
Category
Recommended Products
SP800 Spectroradiometers Integrating Sphere Measurement System
SP900 Spectroradiometers Integrating Sphere Measurement System
CI503P COLOR ANALYZER
CI550 COLOR ANALYZER
CL138 UV light meter
CI510 COLOR ANALYZER
CL503 illuminance colorimeter
CI300 Color Analyzer
CL300 illuminance colorimeter
CI820 SPECTRAL LUMINANCE COLORIMETER
Contact Us
E-mail:info@huicolor.com
Tel:0086 755 2317 9385
Mobile:0086 135 0006 9487
SP900 Spectroradiometers Integrating Sphere Measurement System
☆ Wavelength Range:320~800nm;
☆ Wavelength Interval:1nm;
☆ Spectrophotometric Mode:Concave Grating
☆ Φv:0.01~200000lm, CCT:1000~100000K;
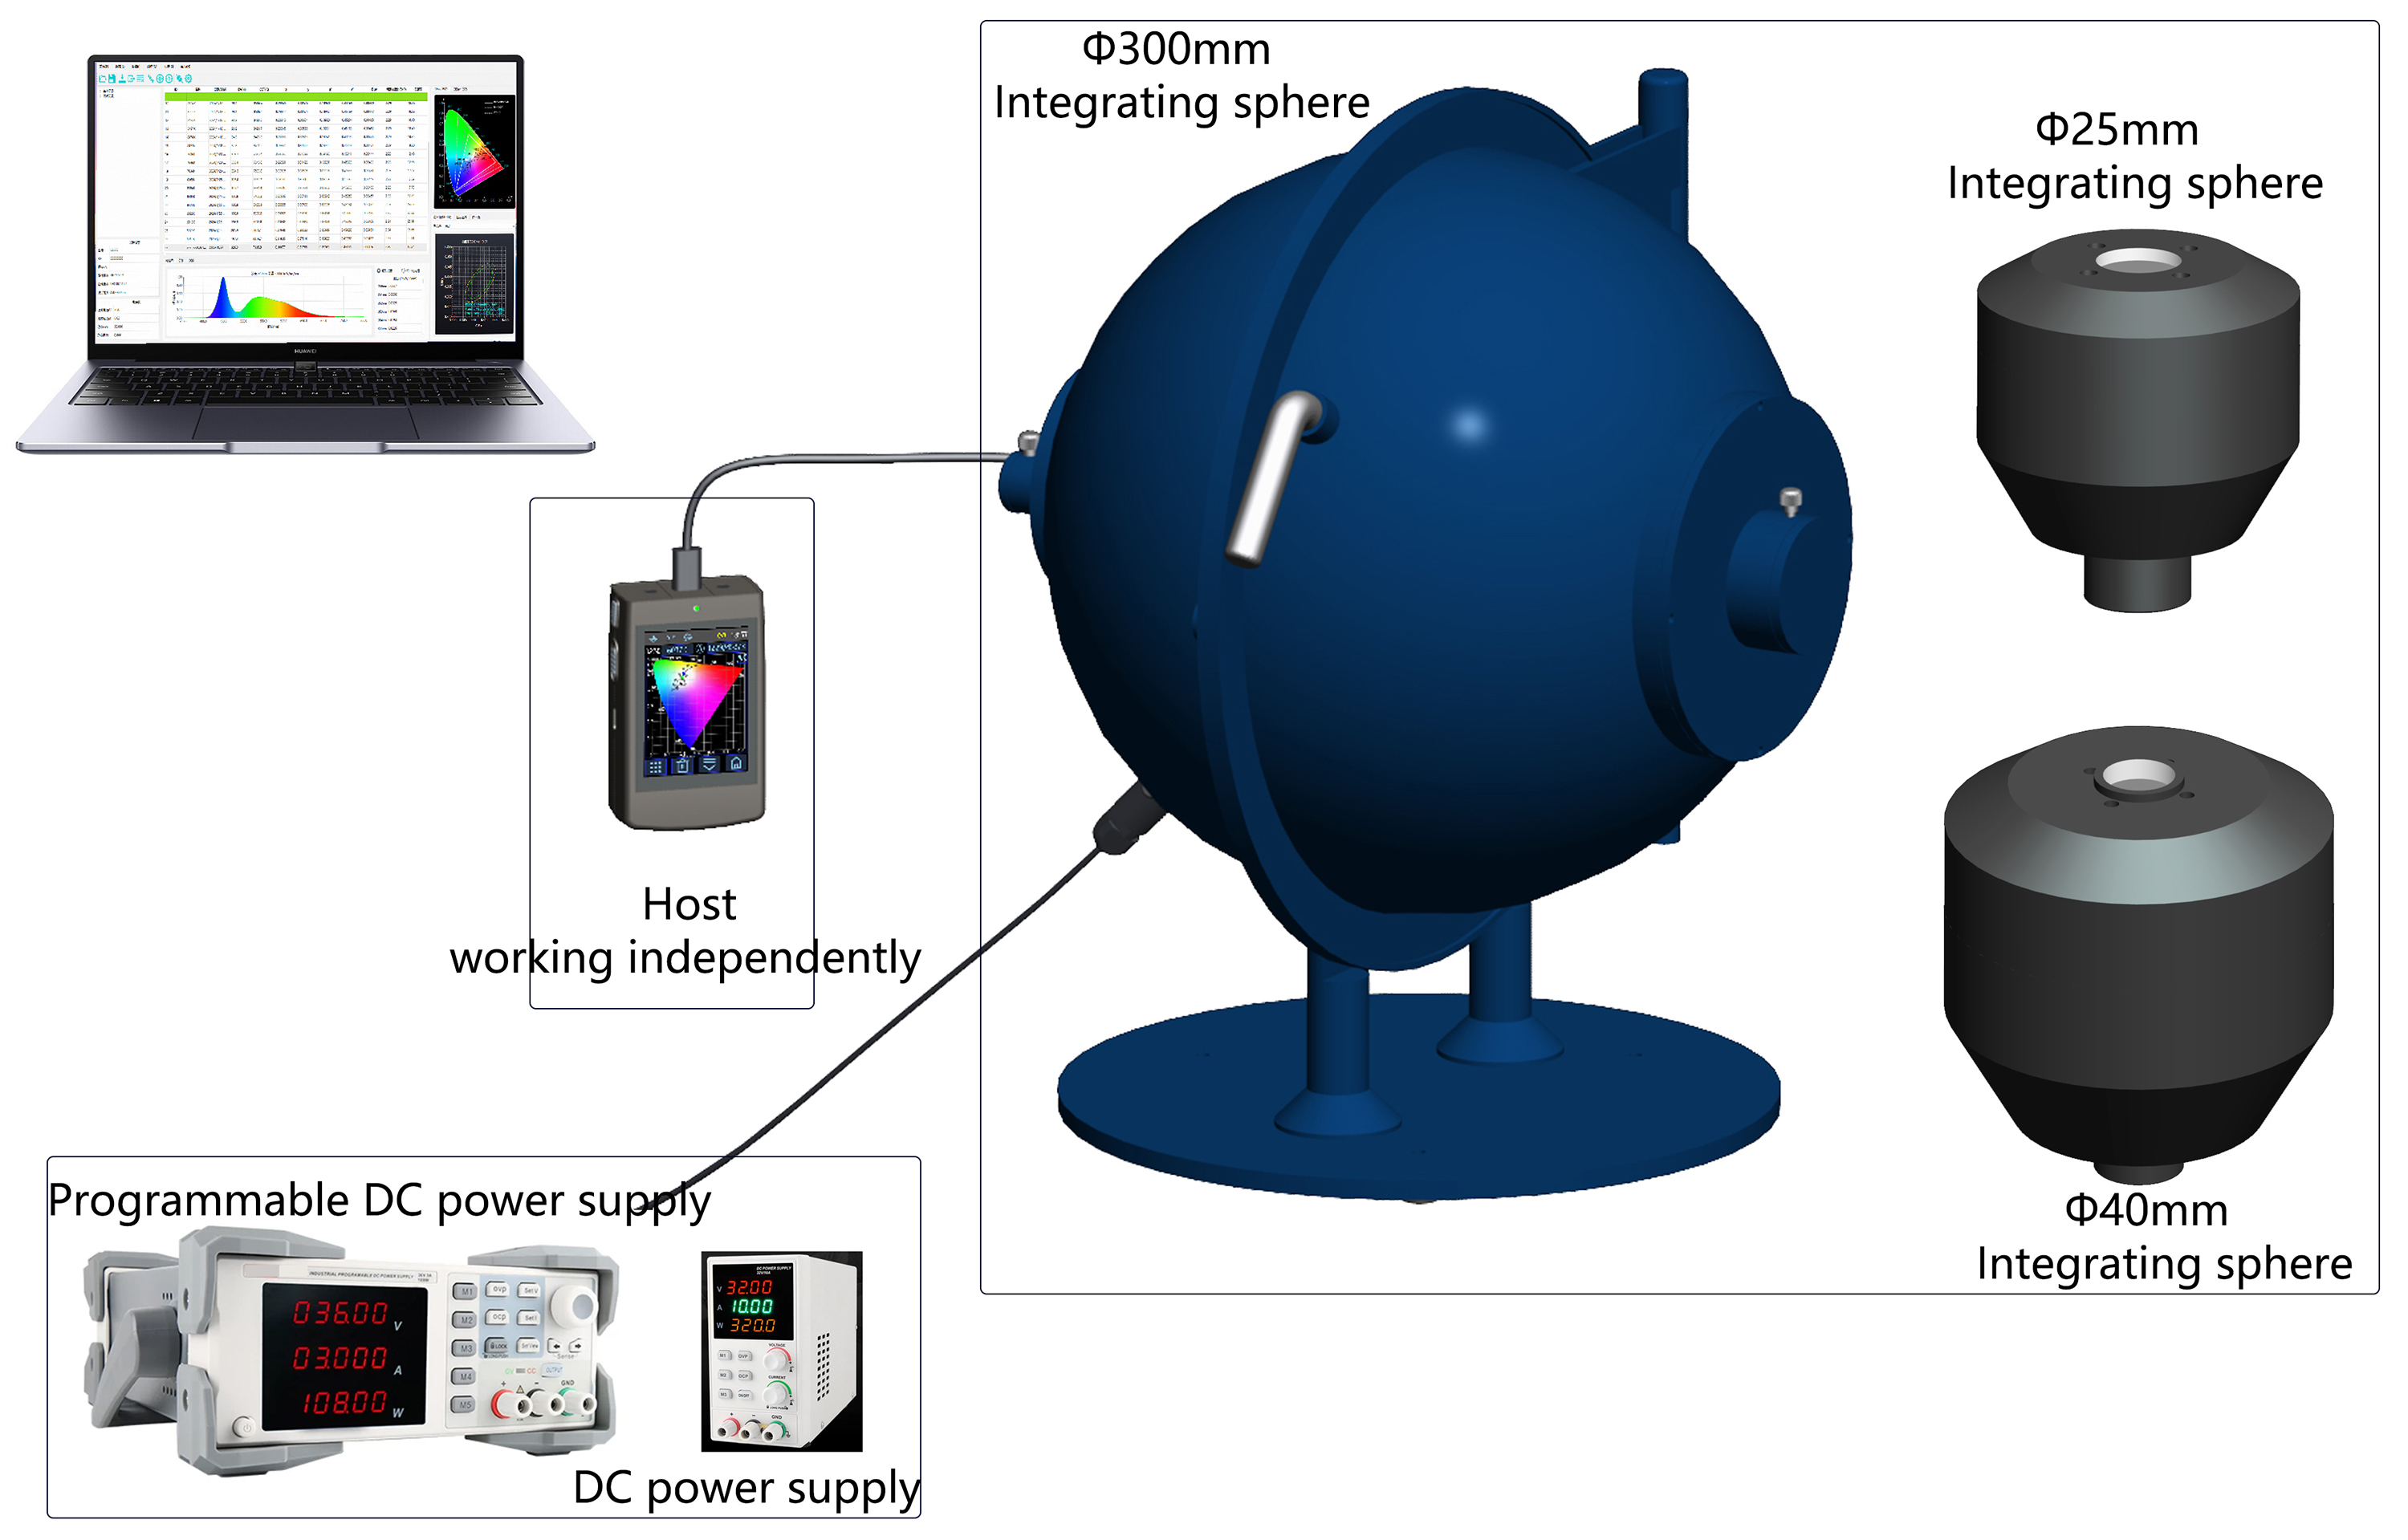
☆ Φ300 mm integrating sphere (other sizes can be customized);
☆ spectrum, luminous flux, luminous efficacy, CCT,CRI , peak wavelength, half bandwidth, CQS, TM-30;
☆ Programmable power supply: 0.01-36V, 0.001-3A, and maximum output power is 108W;
☆ The host and power supply can be used separately or connected to a computer for use;
☆ Measurement Mode: Auto mode,Flash mode, Continuous mode, Average mode ;
☆ Display: 2.8-inch TFT color LCD, Capacitive Touch Screen;
☆ Battery: Li-ion battery,3.7V,4000mAh(8000 measurements within 24 hours);
☆ Data Port: Type C USB,Bluetooth 5.0(Customizable WIFI);
☆ Data Storage: Sample 10000 Pcs;
☆ Dimension: L*W*H=98X62X30mm,USB data cable: 500mm;
1. Product Introduction
The SP900 Spectroradiometers Integrating Sphere Measurement System is an optoelectronic color measurement system independently developed by Huicolor with fully owned intellectual property rights. The spectrometer uses a high-precision concave grating as the dispersing element, and can acquire the radiant spectrum of light sources over the 320–800 nm wavelength range, outputting the radiant spectrum at 1 nm intervals. The luminous flux measurement range can reach up to 200,000 lm (varies slightly depending on the integrating sphere configuration).
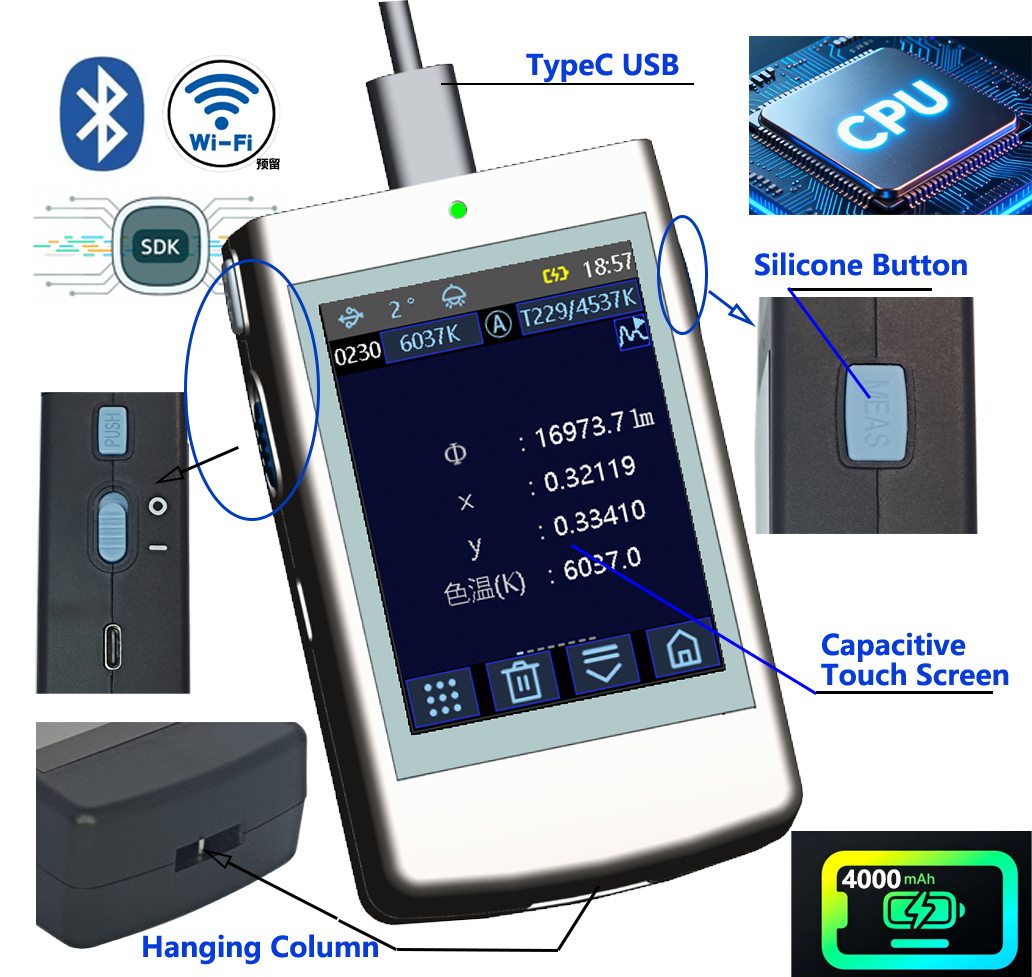
The spectrometer host is equipped with a 2.8-inch TFT capacitive touch screen, a 4000 mAh lithium-ion battery, a Bluetooth/Wi-Fi multi-function chip, and a large-capacity memory. It can independently complete photometric parameter tests, including spectrum, luminous flux, luminous efficacy, chromaticity coordinates, dominant wavelength, peak wavelength, half bandwidth, and color rendering index.
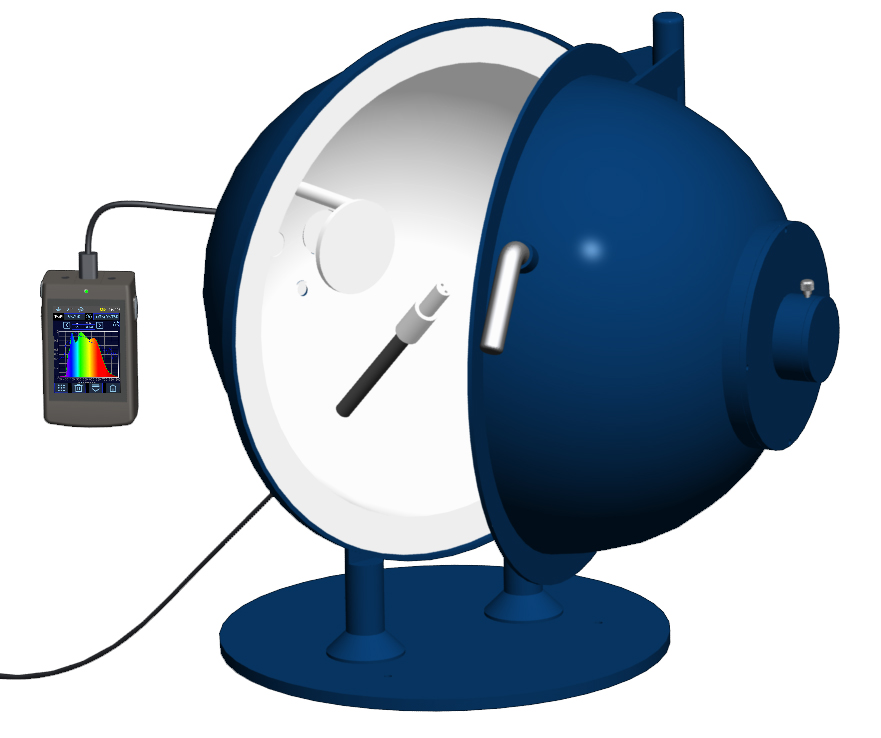
The SP900 comes standard with a Φ300 mm integrating sphere (other sizes can be customized). The central LED support-rod fixture (standard) can measure the radiant spectrum and photometric parameters of through-hole LED light sources and tungsten filament lamps, while the side LED fixture can measure the radiant spectrum and photometric parameters of SMD LED light sources and other light sources. Users can select the appropriate light source fixture according to the light source.
The programmable DC regulated power supply provides an output voltage range of 0.01–36 V, a drive current of 0.001–3 A, and a maximum output power of 108 W, with a single output channel. The power supply can be connected to a computer for use, or can be used independently.
The SP900 is equipped with the professional color management software-HIQC, which allows the spectrometer to be controlled via a computer to test parameters such as the radiant spectrum and luminous flux of light sources, print reports, and export spectral and photometric data to Excel files. It is powerful and easy to use.
The SP900 can not only measure technical parameters such as radiant spectrum, luminous flux, luminous efficacy, color temperature, chromaticity coordinates, color rendering index, dominant wavelength, peak wavelength, half bandwidth, and white balance, but also measure plant grow light parameters, UVI index, blue light hazard, CQS, TM-30, TLCI-2012 and other parameters. It is highly versatile and widely used.
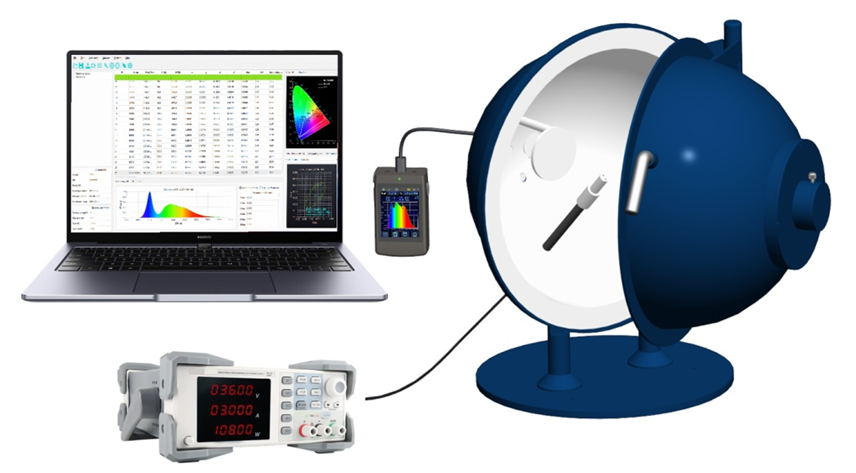
Fig. 1
2. Product Features
1. The spectrometer uses a high-precision concave grating as the dispersing element and a 256-pixel CMOS as the detector, with a compact structure. It can measure the radiant spectrum and luminous flux of LED light sources, tungsten filament lamps, xenon lamps and other light sources within the 320–800 nm wavelength range, featuring high measurement accuracy, 0.3 nm wavelength accuracy, and 1 nm spectral output.
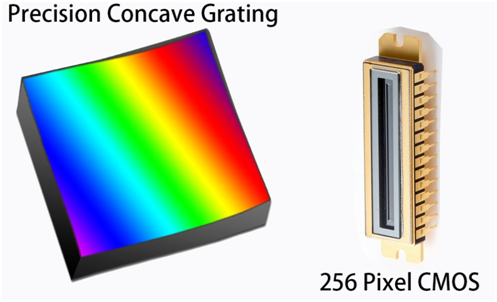
Fig. 2
2. The spectrometer host uses an industrial-grade MCU processor and is equipped with a 2.8-inch TFT capacitive touch screen with storage capacity of up to 10,000 records. The host can independently complete spectrum and luminous flux measurement of the light source. The host is connected to the integrating sphere via a Type-C data cable, providing precise measurement, simple operation, and great convenience.
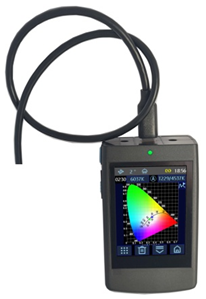
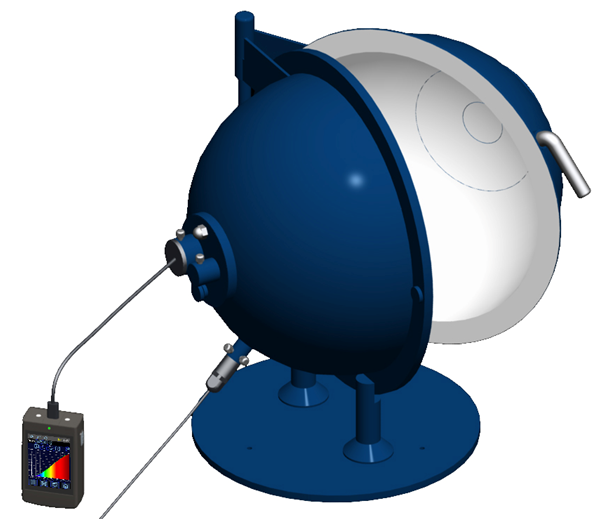
Fig. 3
3. The spectrometer host is compact in design and equipped with a 4000 mAh lithium-ion battery for long standby time. It features Type-C and Bluetooth 5.0 interfaces, with a reserved Wi-Fi interface. The rich expansion interfaces make it very suitable for secondary development and give it a wide range of applications.
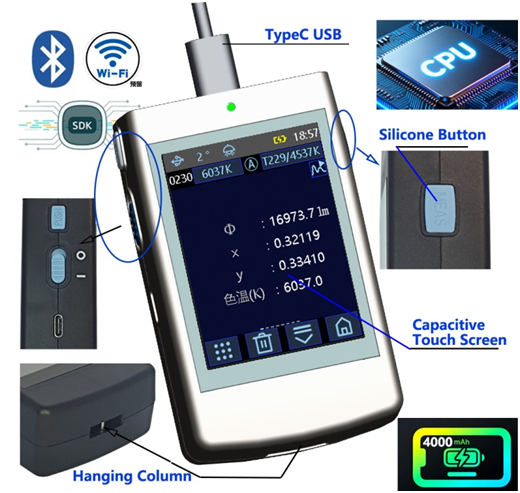
Fig. 4
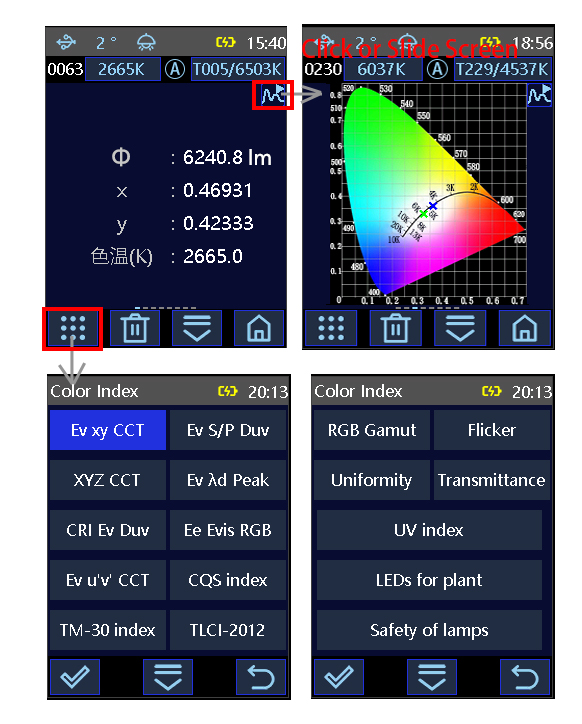
4. The SP900 can test technical parameters such as radiant spectrum, luminous flux, color temperature, chromaticity coordinates, color rendering index, dominant wavelength, peak wavelength, half bandwidth, and white balance; it can also measure plant grow light parameters, UVI index, blue light hazard, CQS, TM-30, TLCI-2012 and other parameters. It is powerful and widely applicable.
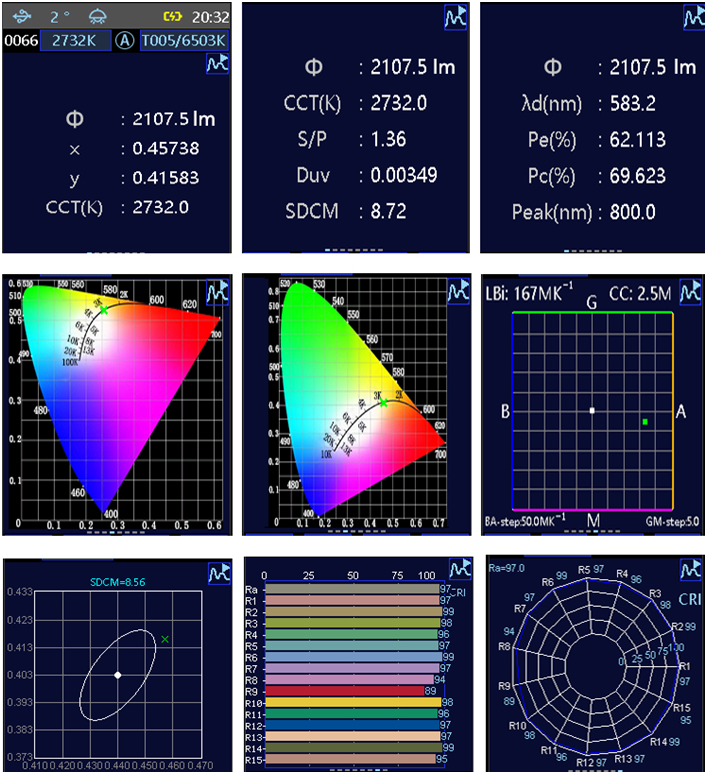
Fig. 5
5. The spectrometer host offers a variety of testing functions with user-friendly function module division, providing simple and smooth operation.
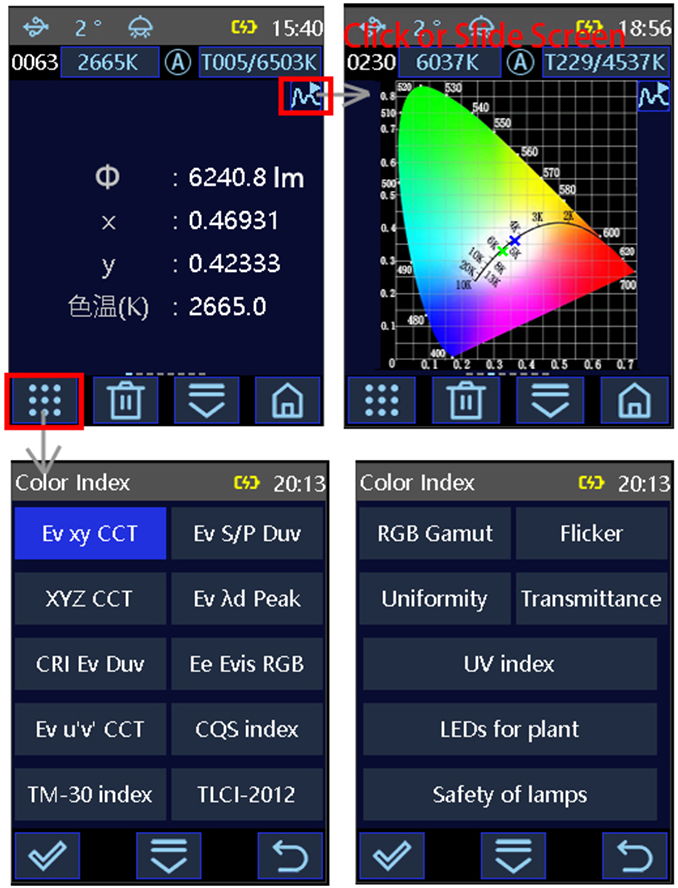
Fig. 6
6. The SP900 is preloaded with the radiant spectra of CIE standard illuminants including D65, A, C, D50 and D75. In comparison mode, it is very convenient to compare the spectrum with the sample under test.
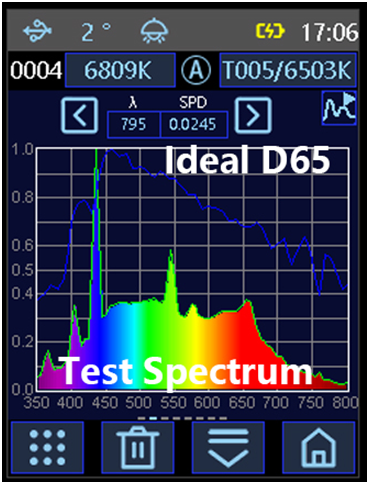
Fig. 7
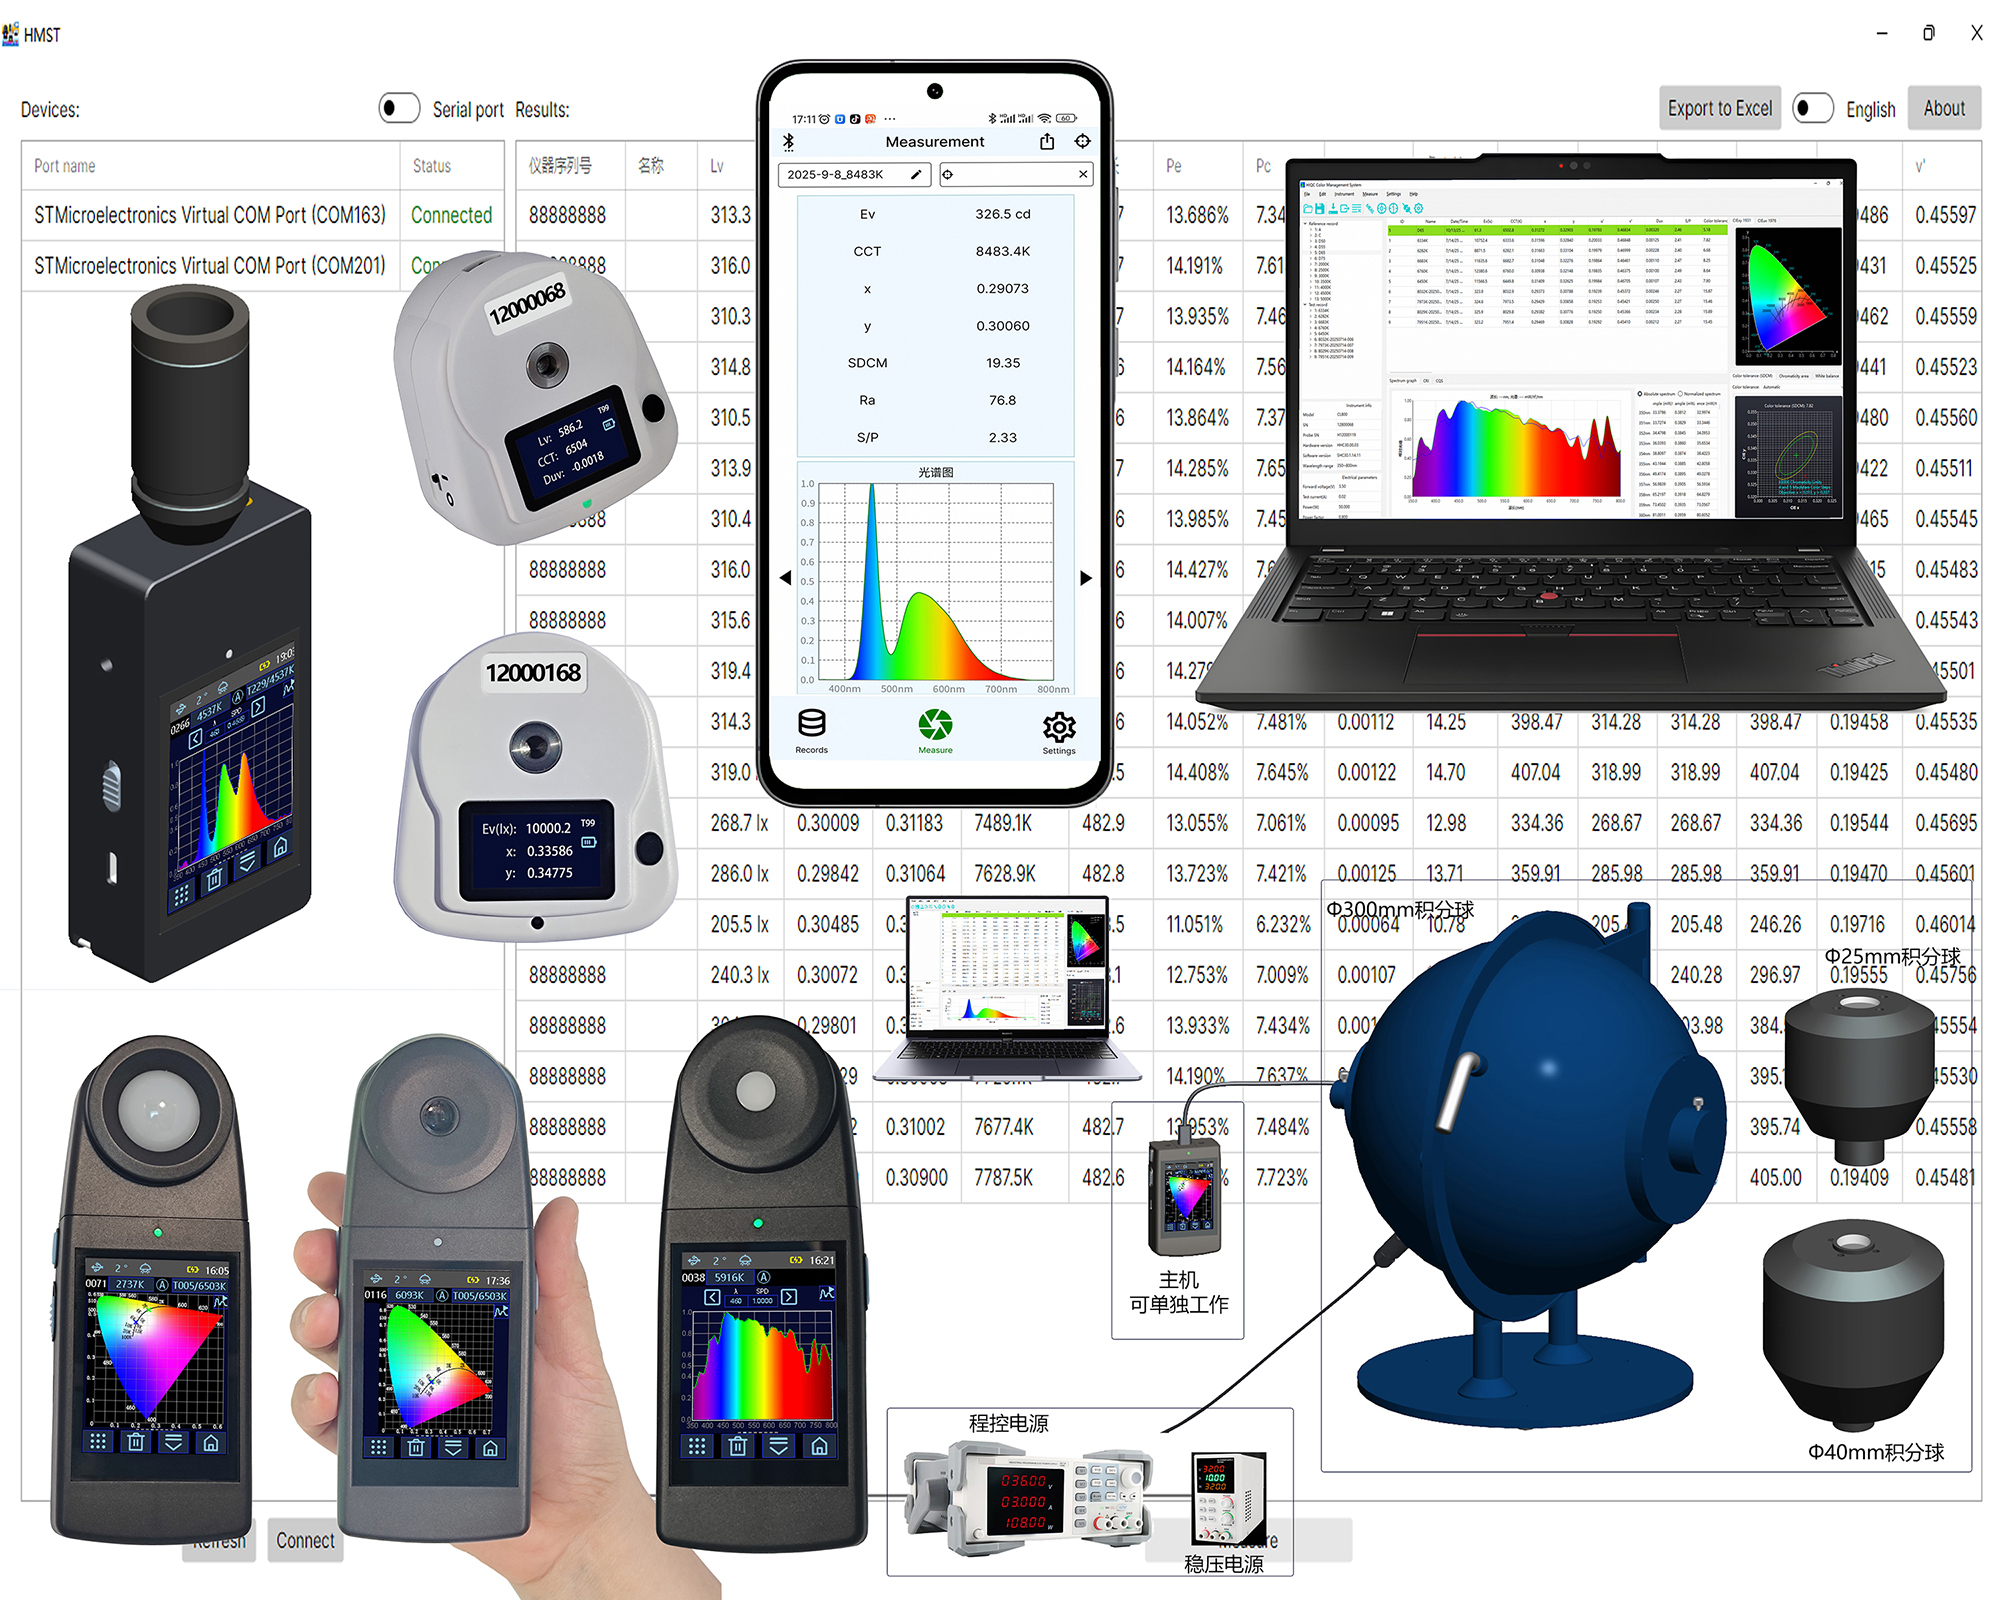
7. The SP900 offers a variety of configurations and flexible use. Users can select integrating spheres of different sizes to meet different luminous flux ranges and measurement accuracy requirements, and can choose the DC power supply drive mode as needed, either computer-driven or manually driven. Users can measure directly through the spectrometer host, control the host via the PC software HIQC, or control it via an Android mobile APP. It is widely used in the LED lighting industry, engineering lighting, laboratory spectral research and other fields.
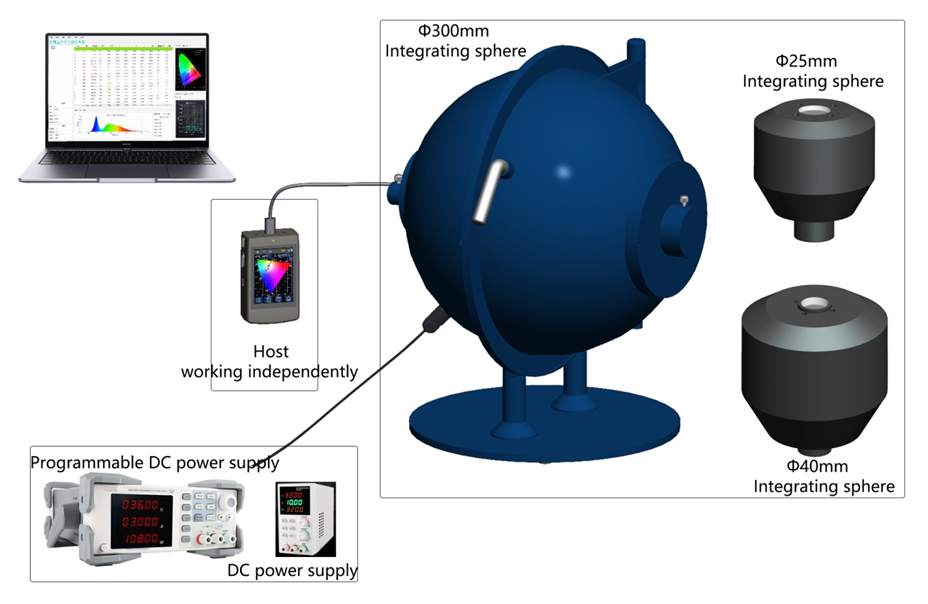
Fig. 8
8. The spectrometer host adopts an automatic temperature compensation algorithm to ensure long-term consistency and stability of measurement data.
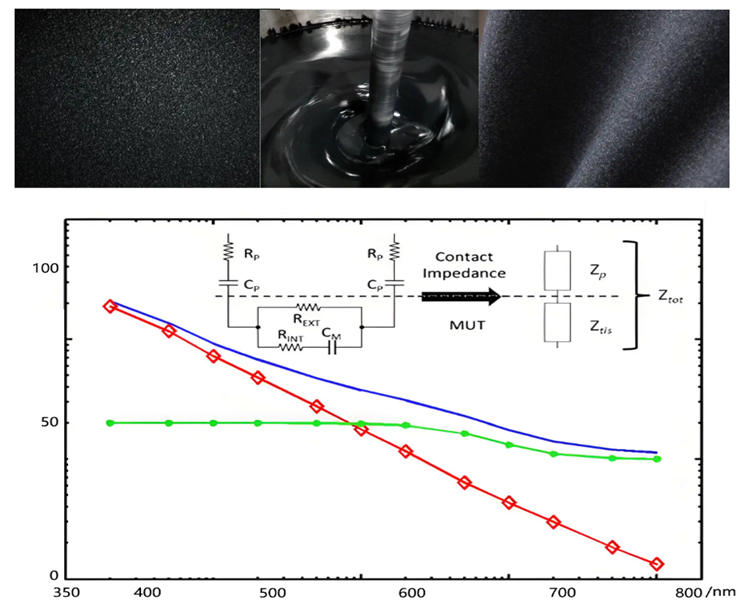
Fig. 9
9. Professional PC host software with a rich SDK (supporting C#, C++, Python, LabVIEW and other platforms).
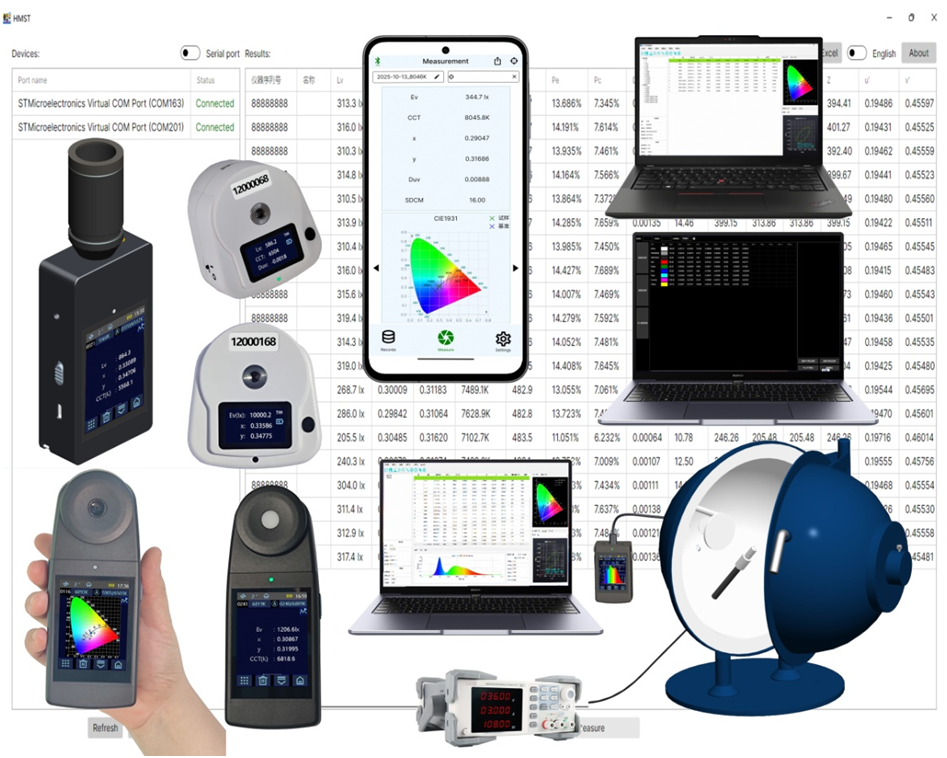
Fig. 10
3. Industry Applications
3.1 Photometric Parameter Testing of LED Light Sources / Solid-State Lighting (Spectrum, Luminous Flux, Color Temperature, Color Rendering Index, Dominant Wavelength, etc.)
The SP900 can easily measure parameters such as spectrum, luminous flux, color temperature, color rendering index, dominant wavelength, mesopic/photopic ratio, peak wavelength, and plant light parameters.
With the professional HIQC host software, the SP900 can easily perform chromaticity classification and chromaticity coordinate screening of solid-state light sources such as LEDs in accordance with the U.S. ENERGY STAR standard.
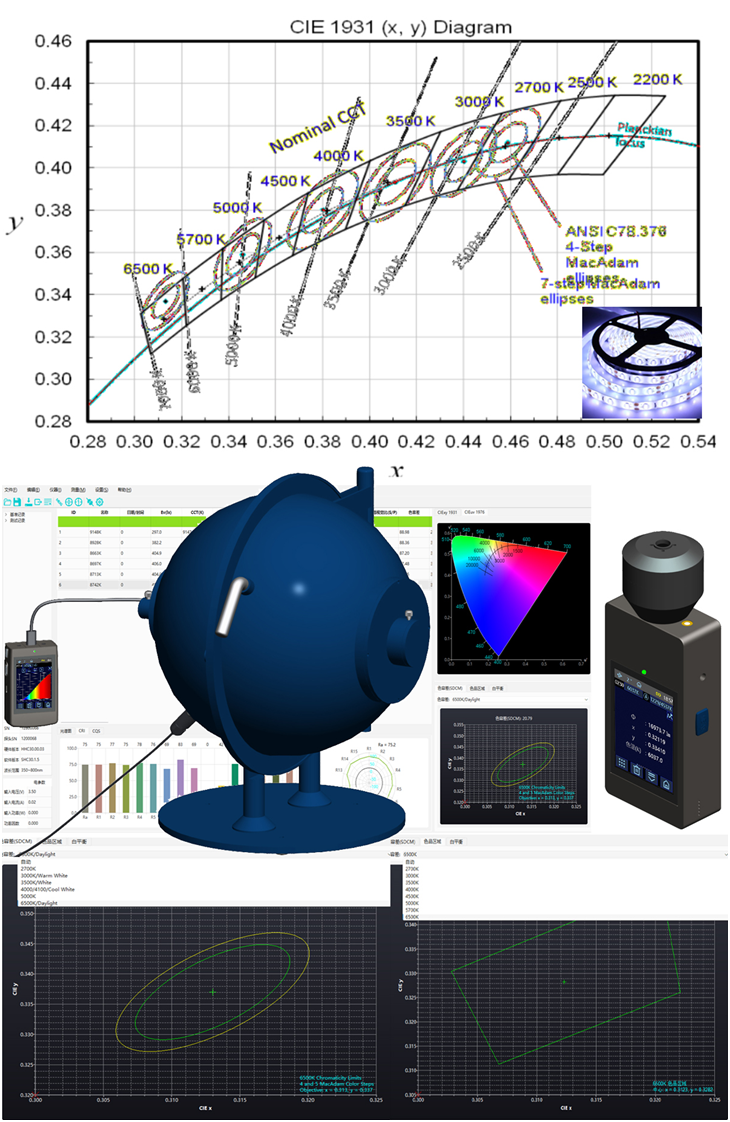
Fig. 11
3.2 Spectral Analysis and Light SPD Comparison of LED Light Sources / Solid-State Lighting
The SP900 can not only accurately measure spectral parameters such as the radiant spectrum, luminous flux, peak wavelength, centroid wavelength, and half bandwidth of the light source under test, but also measure the radiant energy proportions of its UV, red (R), green (G), blue (B), far-red (Fr) and infrared (Ir) components.
For demanding LED light distribution curve applications, the PC-based HIQC software can not only measure and compare indicators such as luminous flux, color temperature, and color rendering index, but also supports spectral curve comparison. The HIQC software is built in with the ideal light source spectra specified by various CIE standards (e.g., D65 and C illuminants) and also supports user-defined standard spectral curves, making it very convenient to compare the spectrum and photometric parameters of the light source under test with standard light sources.
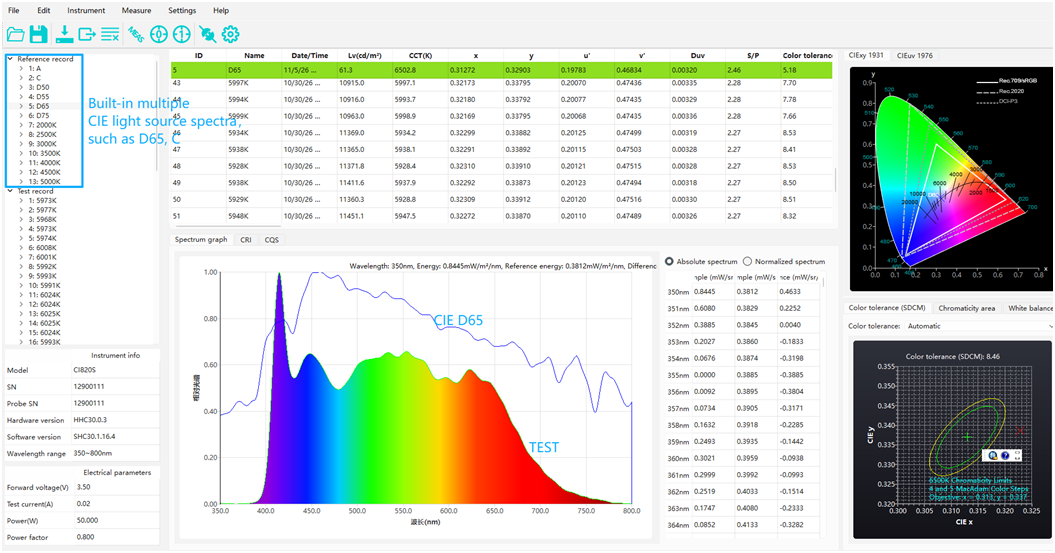
Fig. 12
3.3 The SDCM measurement and Quality control of LED/Solid-State Lighting
The HIQC software is built in with the standard color tolerance and color gamut polygon curves specified in the ENERGY STAR standard, making it convenient for users to measure and compare.
The HIQC software also supports user-defined color gamut polygons, allowing users to conveniently carry out quality control of the color of LEDs.
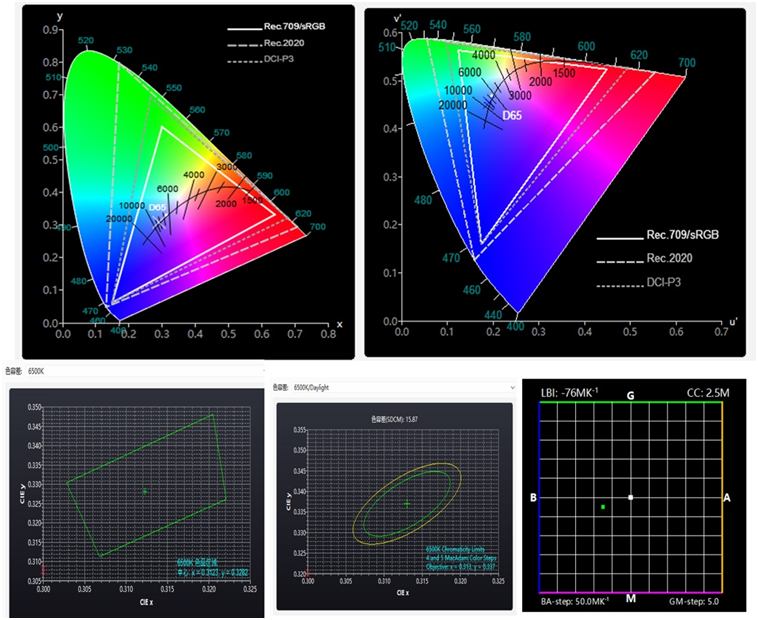
Fig. 13
3.4 Easy Maintenance and Low Long-Term Operating Cost of the SP900
The SP900 is spectrally calibrated before leaving the factory, so users can directly measure the radiant spectrum and luminous flux of light sources with the spectrometer host.
If users have the radiant spectrum of a traceable standard light source, they can also choose to input the standard lamp's radiant spectrum through the HIQC host software and then use that standard lamp to calibrate the SP900, so that the calibrated SP900 test data can be traced back to the standard light source.
If users only have the luminous flux and color temperature of a standard lamp, they can use the calibration correction function of the spectrometer host to correct the data of the SP900, making the instrument data more accurate. After the instrument has been used for many years (more than 5 years), users can use this method to keep the instrument data precise.
The host of the SP900 adopts the standard Modbus RTU communication protocol and can communicate via serial port (Type-C USB) or Bluetooth. The manufacturer provides a rich SDK (supporting C#, C++, Python, LabVIEW and other platforms), making the SP900 very convenient for secondary development and widely applicable.
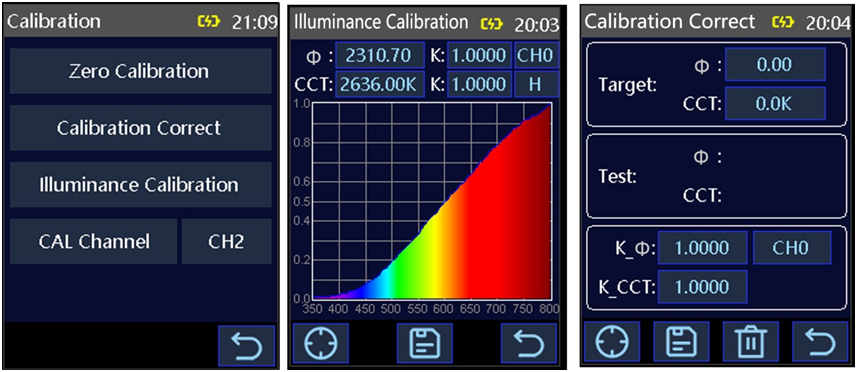
Fig. 15
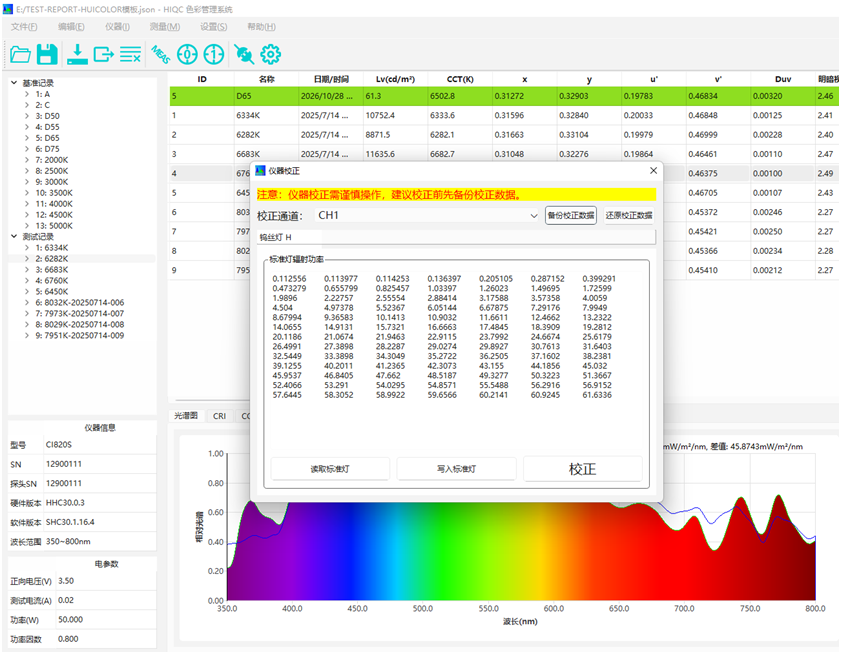
Fig. 16
3.5 Convenient Report Printing and Export of Test Data with the SP900
The SP900 can not only conveniently measure parameters such as the radiant spectrum and luminous flux of light sources, but also use the HIQC software to save test data over the long term and establish a data traceability system.
Users can also use the HIQC software to print test data reports or export test data to Excel files.
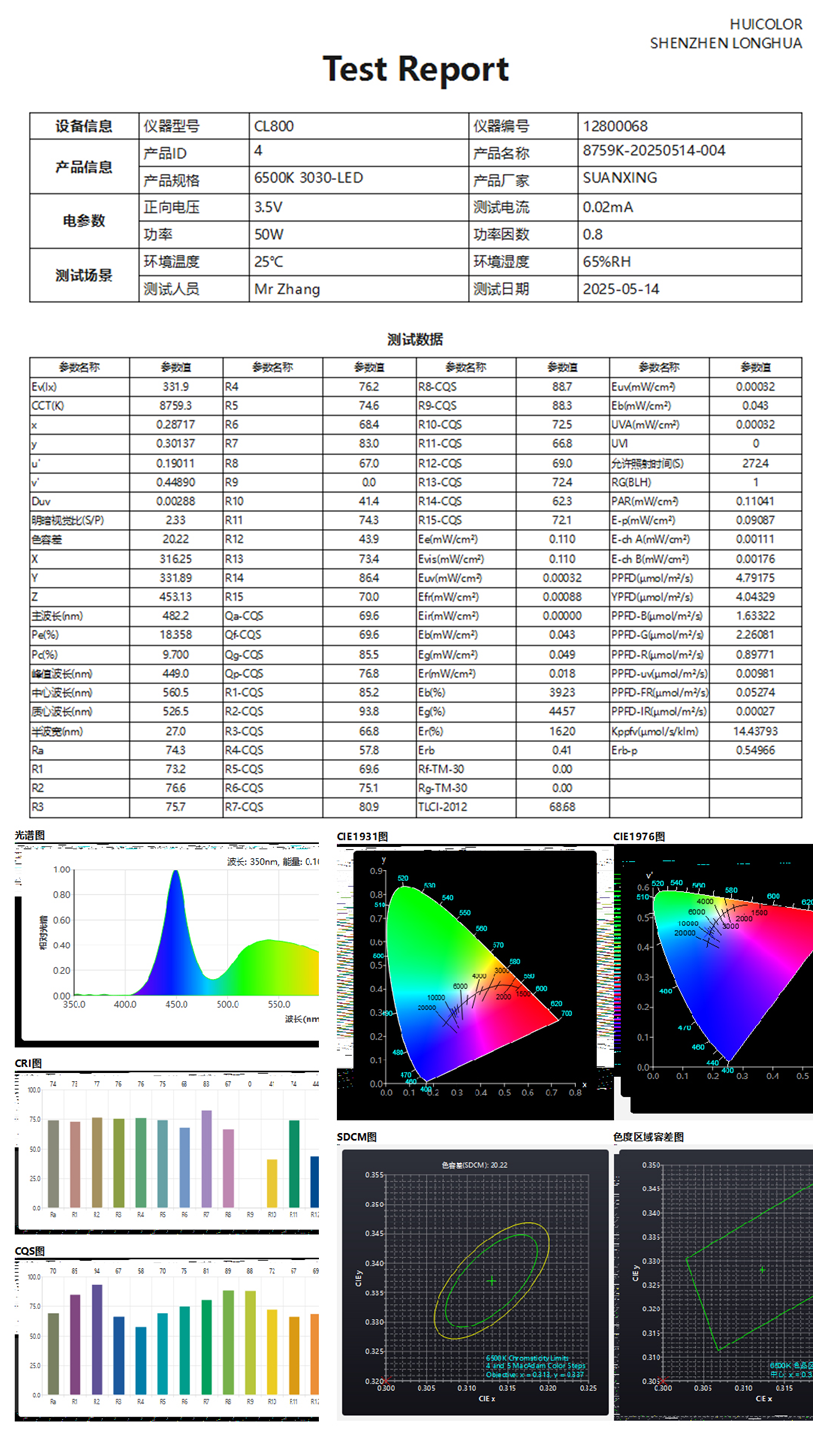
Fig. 17
4. Structure & Dimensions
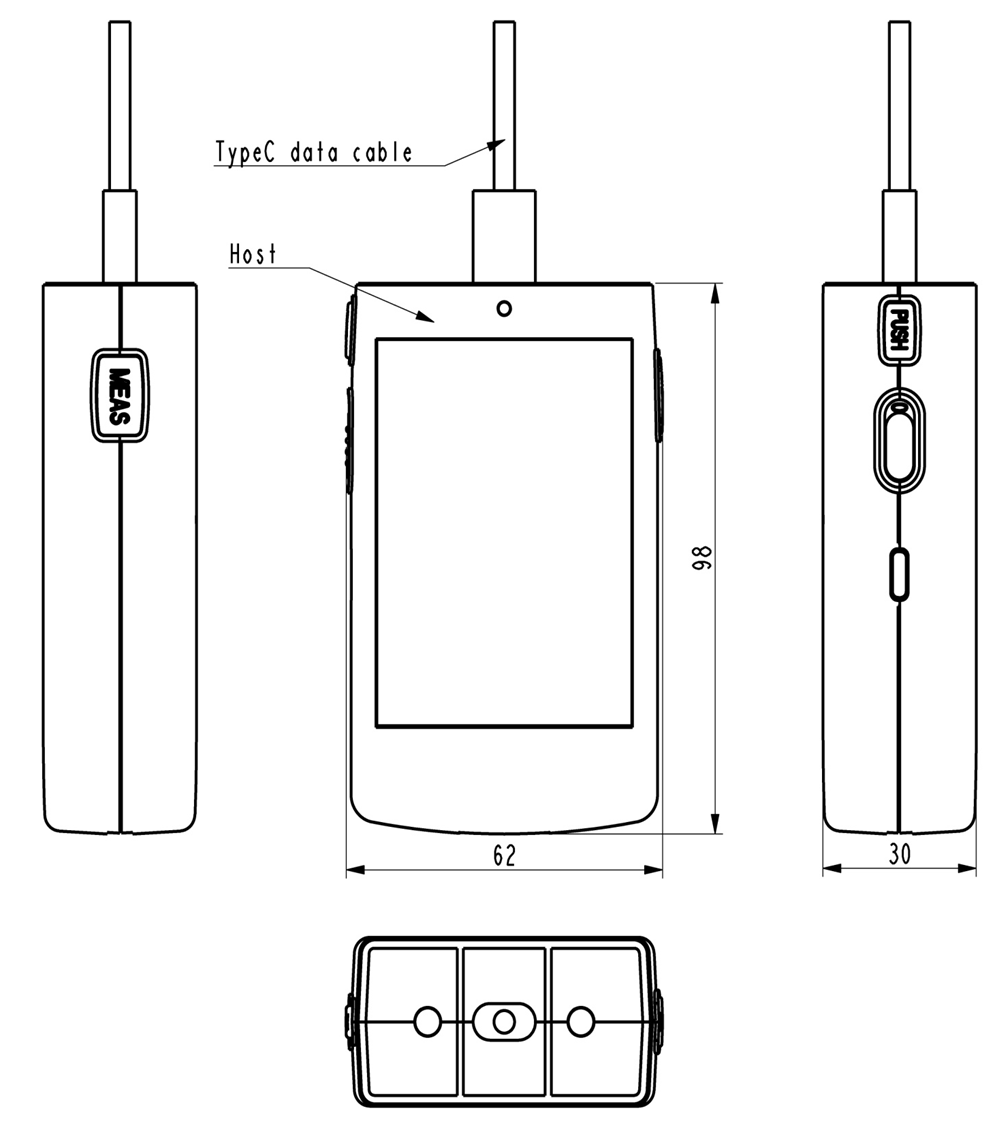
Fig. 18
5. Technical Specifications
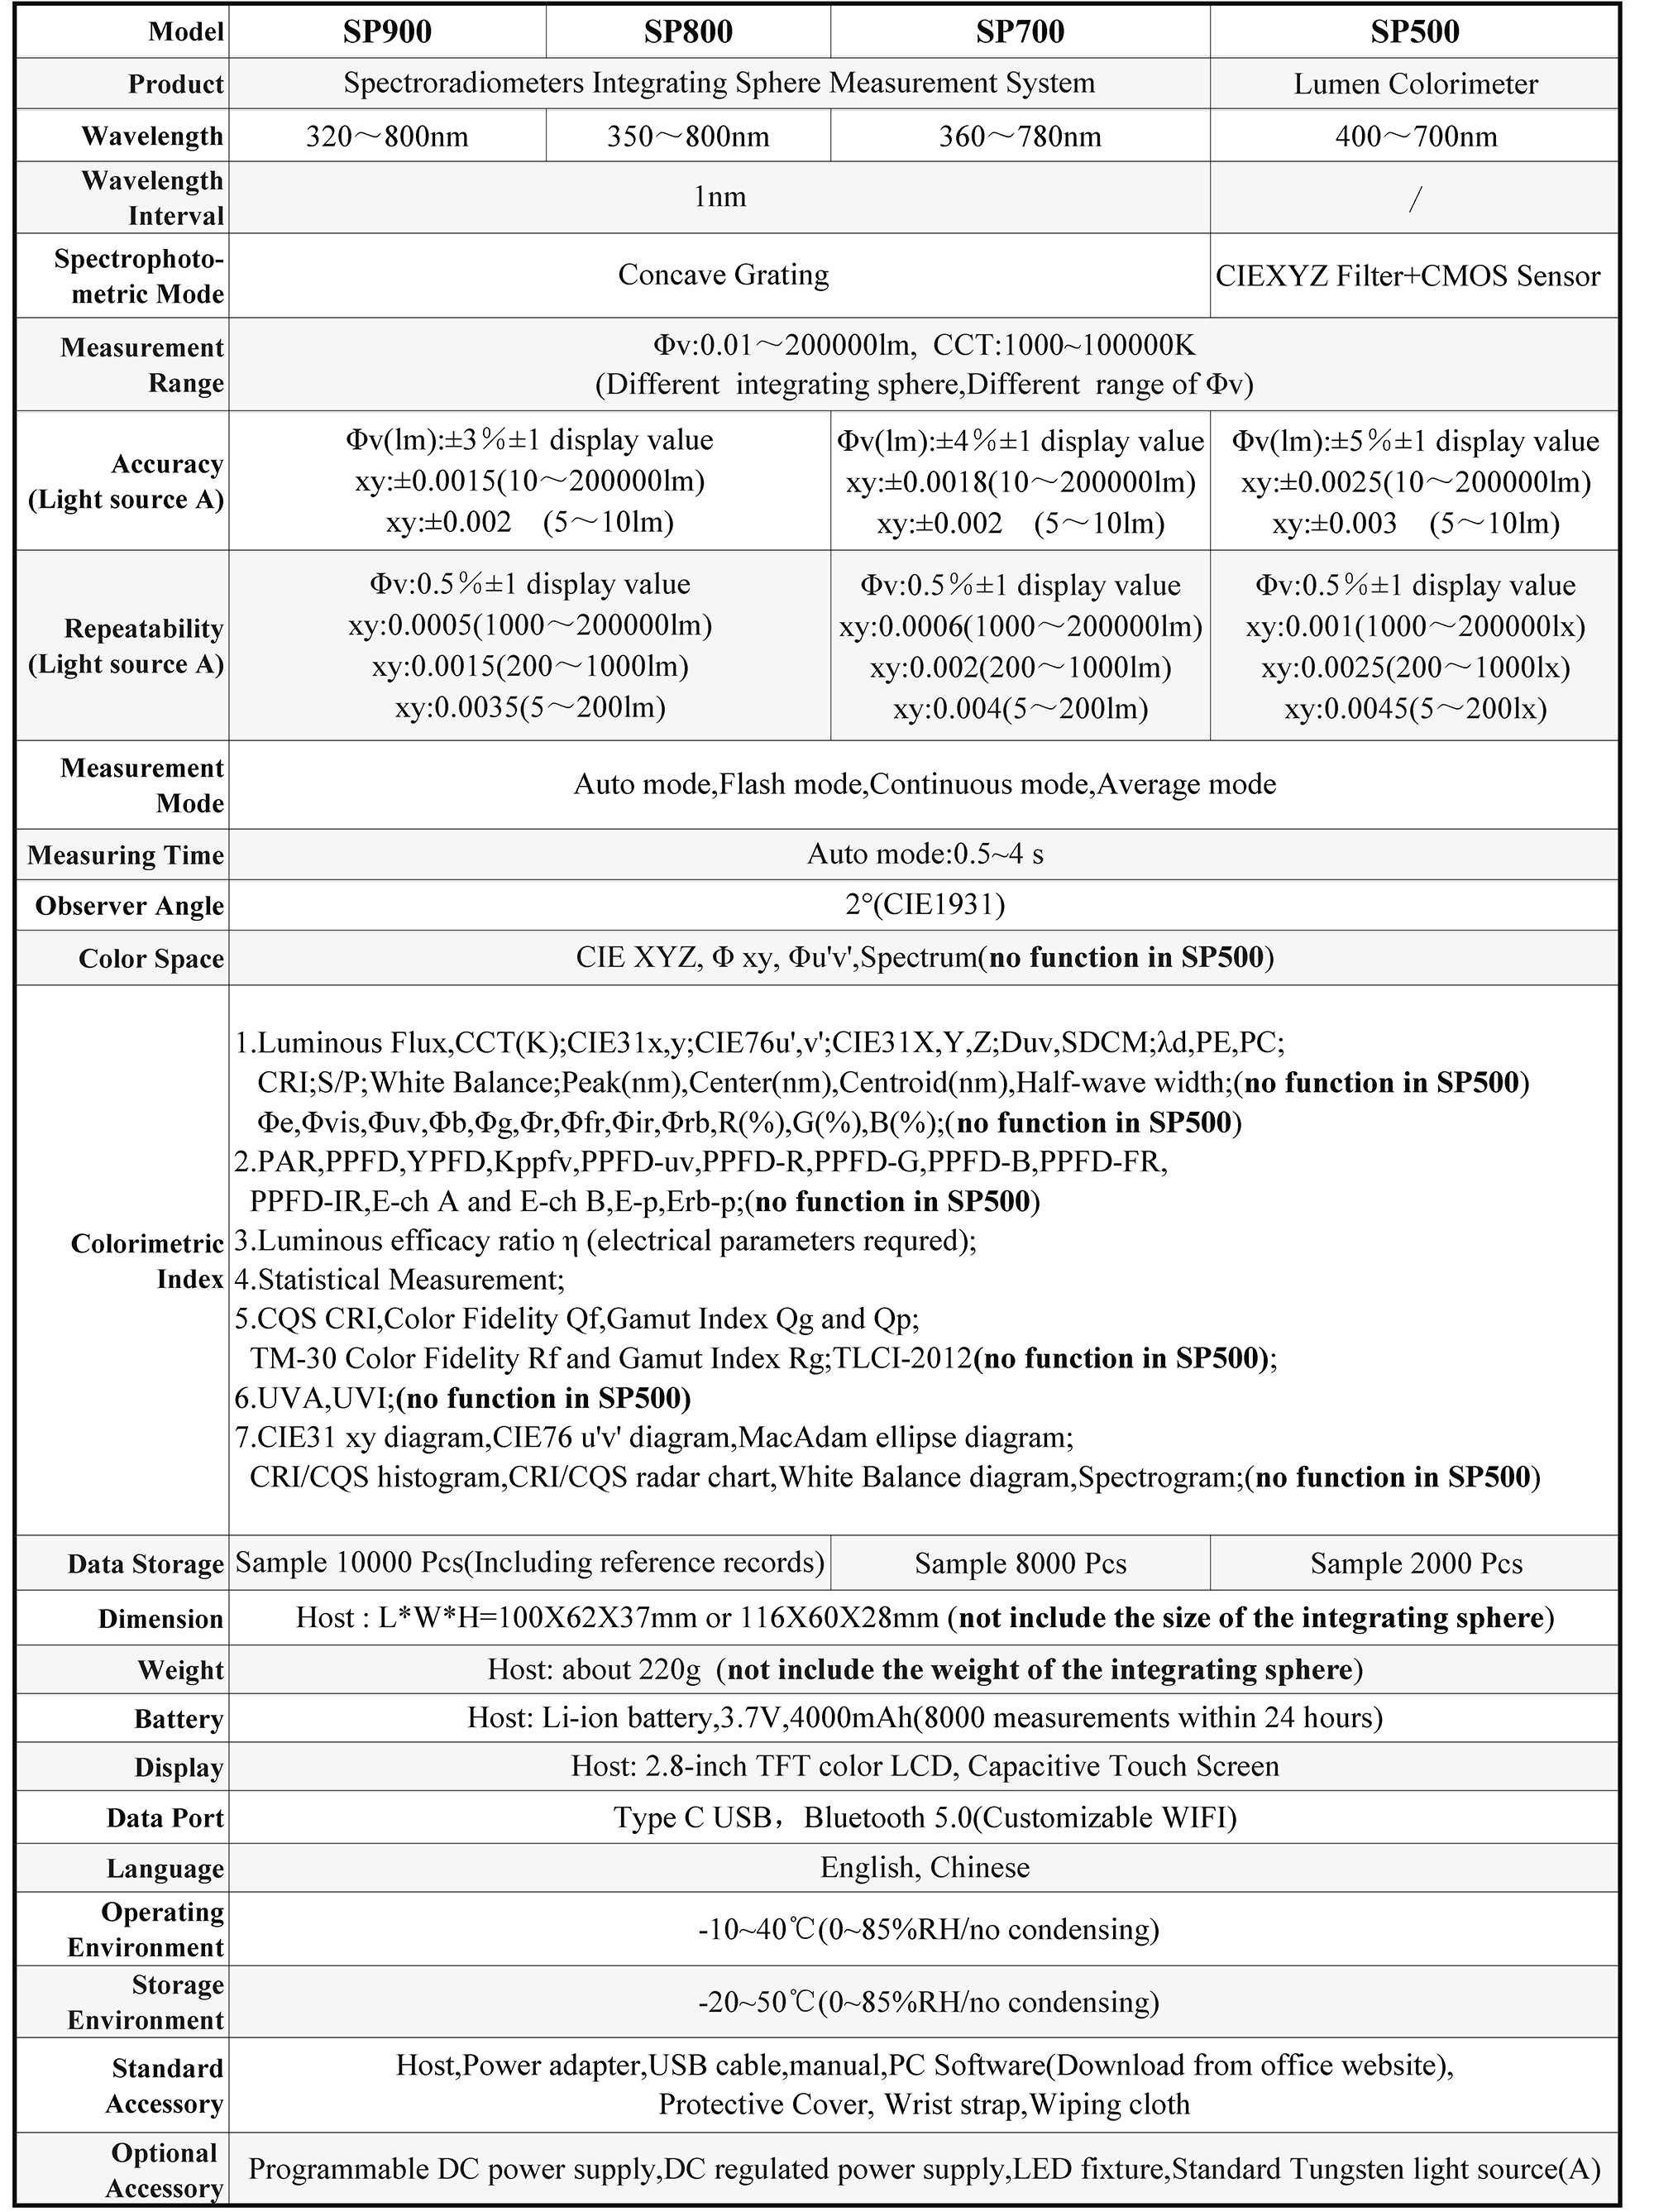
Fig. 19
- Pre:No More
- Next:SP800 Spectroradiometers Integrating Sphere Measurement System