
Category
Recommended Products
CI503P COLOR ANALYZER
CI550 COLOR ANALYZER
CL138 UV light meter
CI510 COLOR ANALYZER
CL503 illuminance colorimeter
CI300 Color Analyzer
CL300 illuminance colorimeter
CI820 SPECTRAL LUMINANCE COLORIMETER
CL320 UV Meter
CI350 LUMINANCE COLORIMETER
Contact Us
E-mail:info@huicolor.com
Tel:0086 755 2317 9385
Mobile:0086 135 0006 9487
CI550 COLOR ANALYZER
☆ Wavelength Range:400~700nm;
☆ Sensor Mode:CIE XYZ Filter+CMOS;
☆ Lv Range:0.01~200000 cd/㎡;
☆ Aperture:Ev: Φ22mm(receiving angle 1°);
☆ MEAS parameters: luminance, chromaticity coordinates, color temperature, screen color difference, flicker, contrast;
☆ Measurement Mode: Auto mode,Flash mode,Continuous mode, Average mode ;
☆ Display: 2.8-inch TFT color LCD, Capacitive Touch Screen;
☆ Battery: Li-ion battery,3.7V,4000mAh(8000 measurements within 24 hours);
☆ Data Port: Type C USB,Bluetooth 5.0(Customizable WIFI);
☆ Data Storage: Sample 2000 Pcs;
☆ Dimension: HOST:L*W*H=116X60X28mm; LENS:Φ30X65mm;
I Product Overview
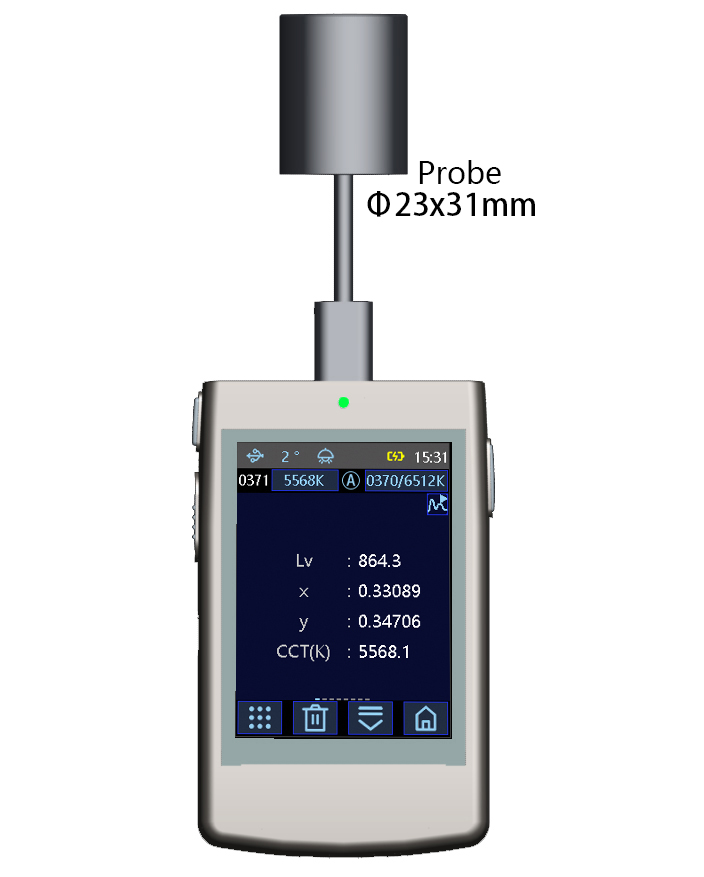
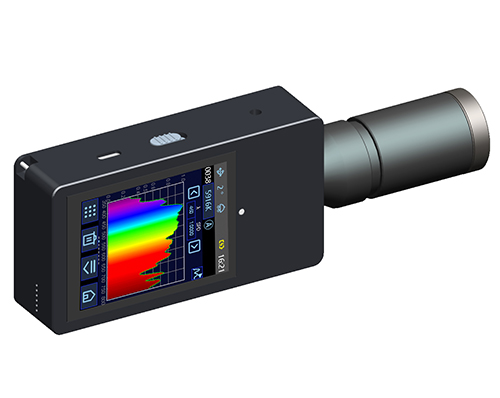
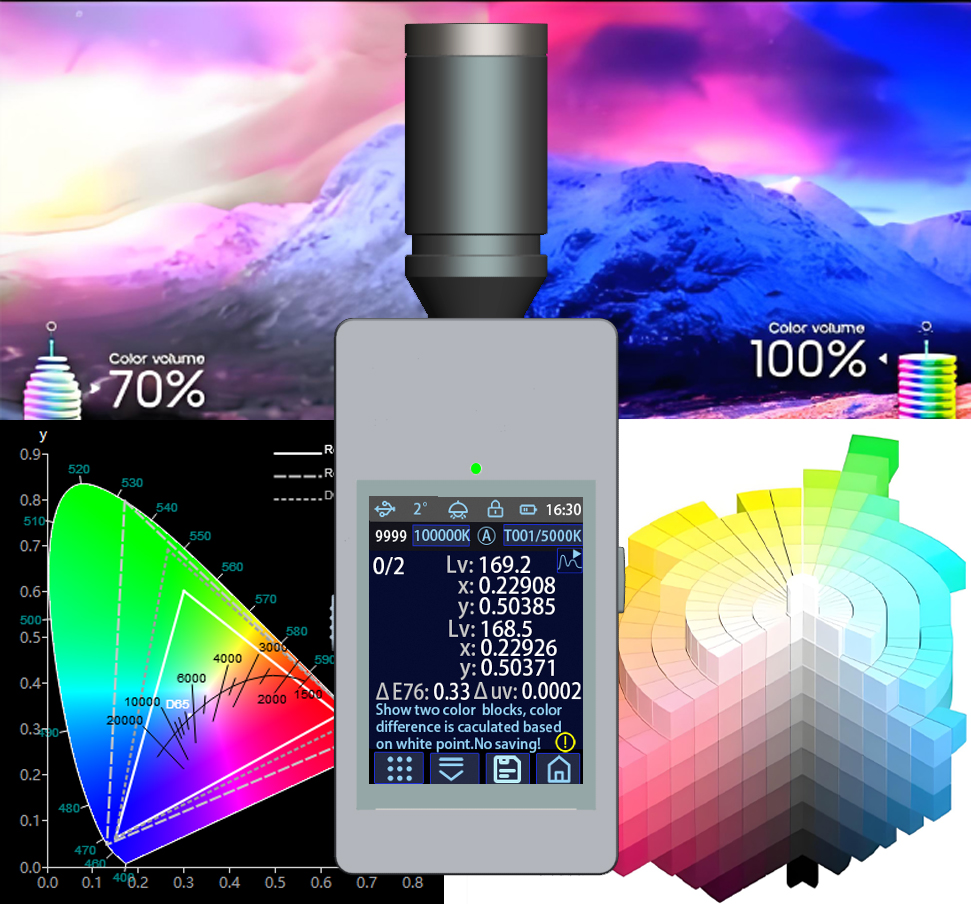
CI550 is a portable luminance colorimeter. The instrument uses XYZ filter+CMOS detector to collect the three stimulus values XYZ of the light source, and then calculates the luminance and chromaticity coordinates of the light source. The instrument has a measuring angle of 1 ° , a minimum measuring area of Φ22mm(Optional Φ 10mm aperture) and a maximum measuring range of 200,000 cd/㎡.
The instrument is equipped with a 2.8-inch TFT capacitive touch screen, 4000 mAh lithium-ion battery, Bluetooth WIFI multifunctional chip, and large capacity memory.
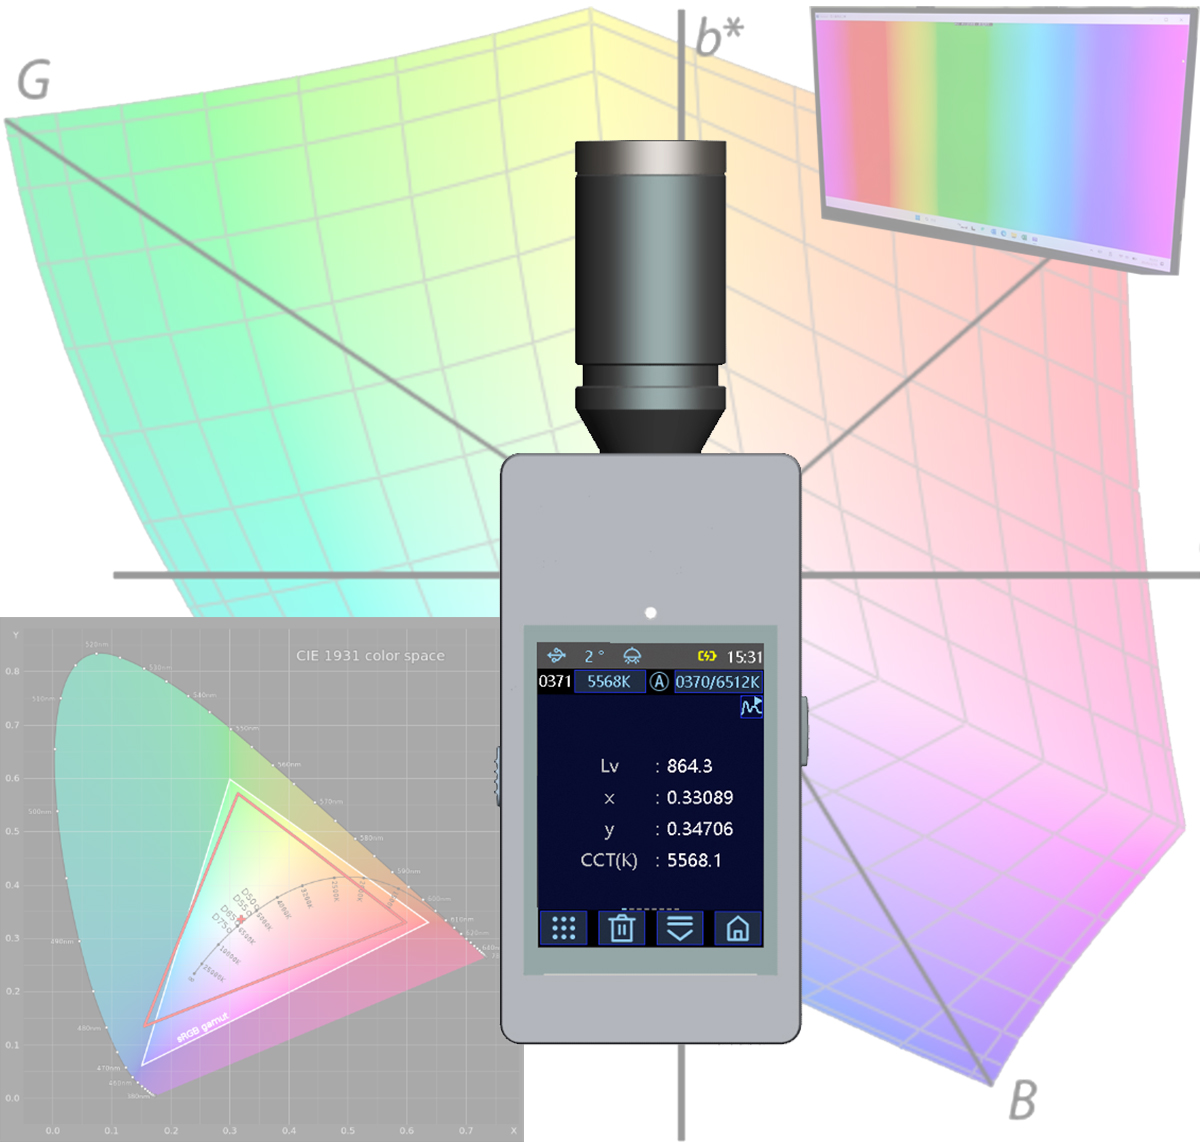
The instrument can measure the luminance(Lv), color temperature, chromaticity coordinates, main wavelength, display gamut, panel uniformity, screen color difference, flicker frequency, contrast ratio, and other parameters.
The instrument is equipped with single measurement, average measurement, continuous measurement, flash measurement, and other measurement modes, easy to operate, accurate and stable measurement.
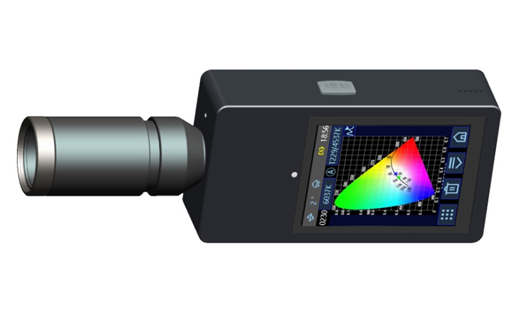
Figure 1
II Product Characteristics
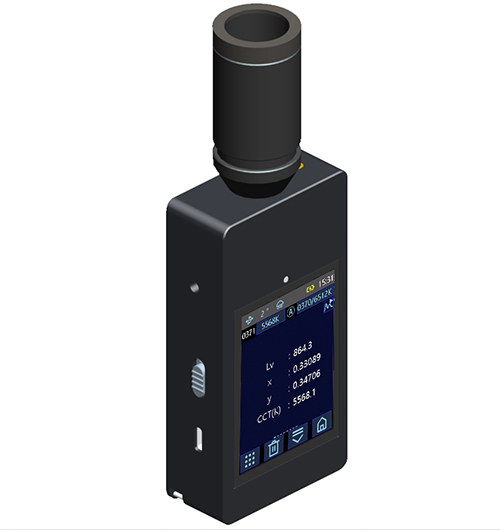
1. The instrument uses XYZ filter+CMOS detector to collect the three stimulus values XYZ of the illumination light source or display in the range of 400-700nm, and then calculates the luminance(Lv), chromaticity coordinates, and color temperature of the sample to be tested, which is cost-effective.
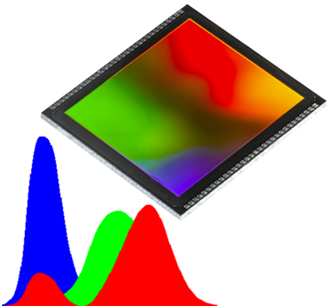
Figure 2
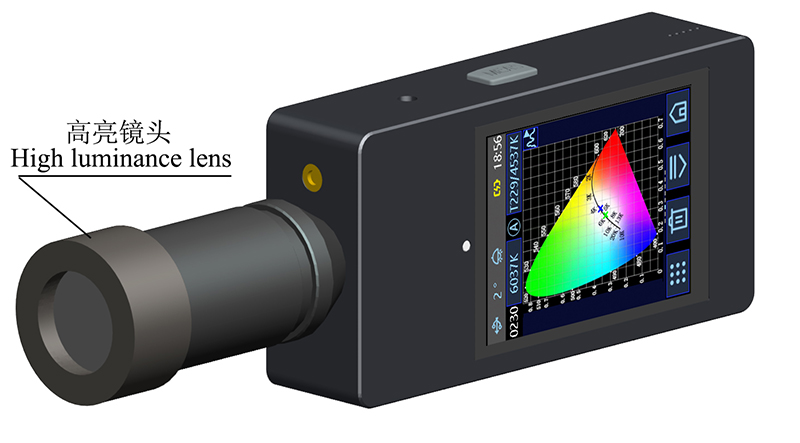
2. The instrument utilizes an industrial-grade MCU processor, equipped with a 2.8-inch TFT capacitive touch screen and up to 2,000 storage spaces. It features simple operation and stable performance.

Figure 3
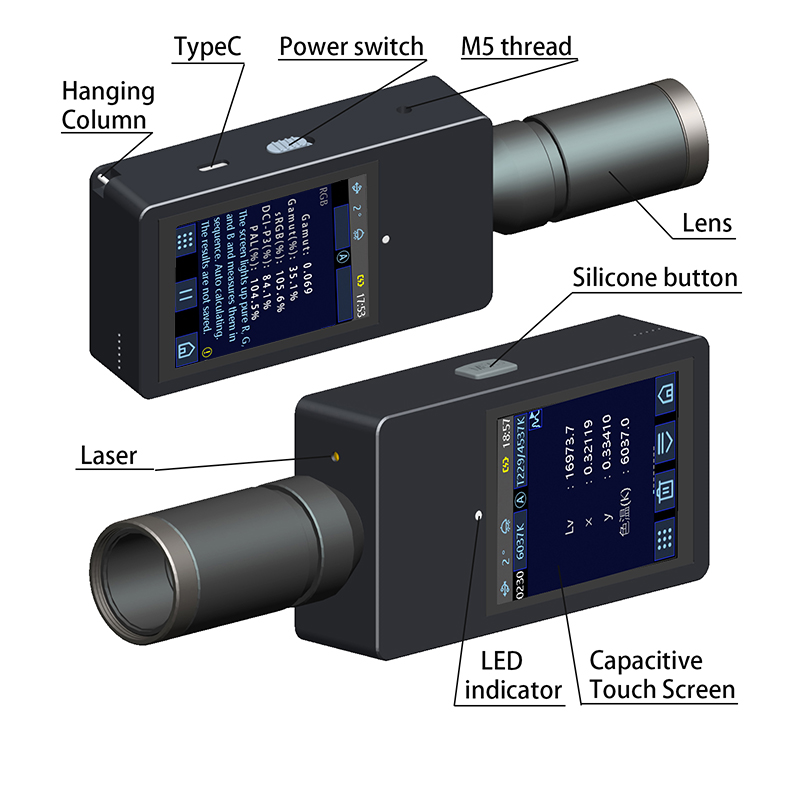
3. The instrument is equipped with a 4000 mAh lithium-ion battery, offering a long standby time. It is also equipped with Type-C and Bluetooth 5.0 interfaces, with a reserved WIFI interface. These rich expansion interfaces are highly suitable for secondary development and have a wide range of application scenarios.
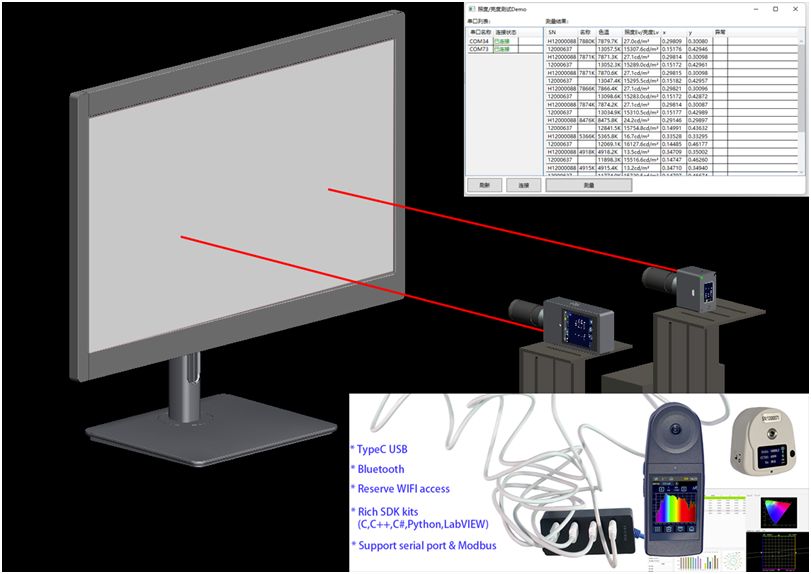
Figure 4
4. A novel and fashionable appearance design based on ergonomics. The instrument has 650nm laser assisted measurement and positioning, which is convenient to use.
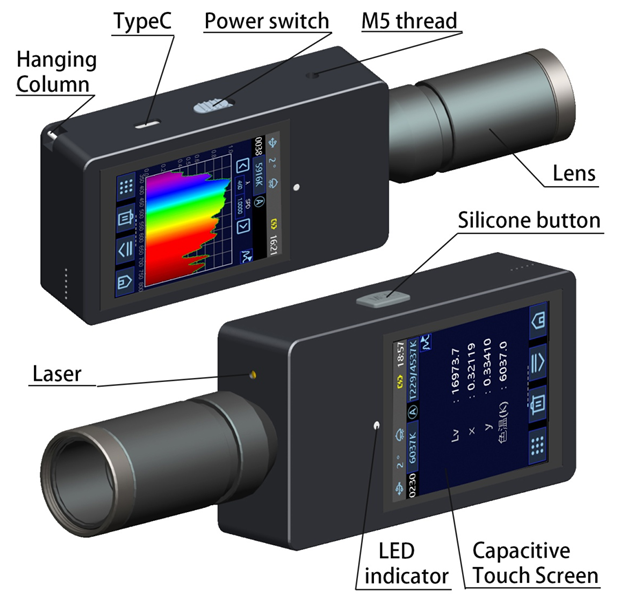
Figure 5
5. The instrument can test parameters such as luminance(Lv), color temperature, transmittance, screen color difference, contrast, flicker, display color gamut, and uniformity. It is easy to use and offers high cost performance.
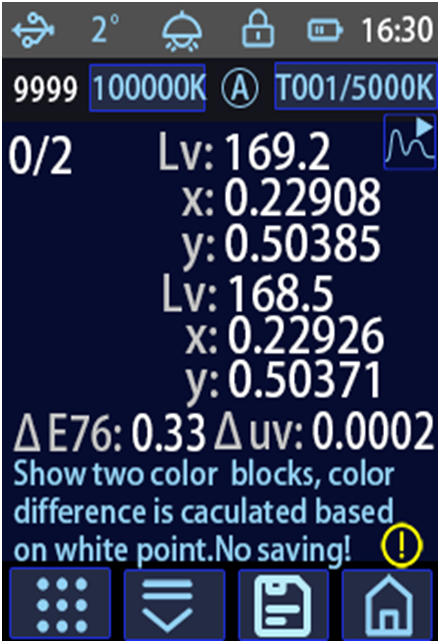
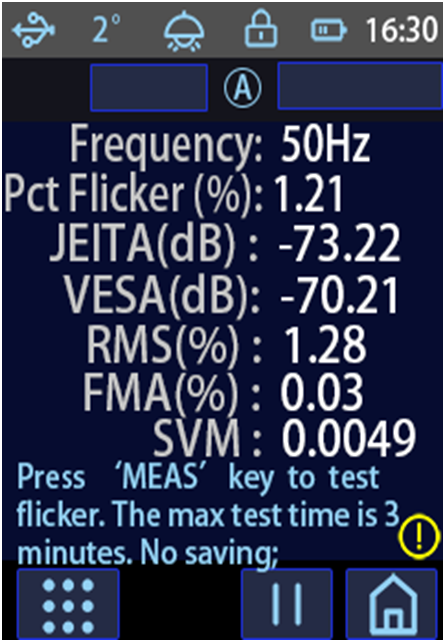
Figure 6
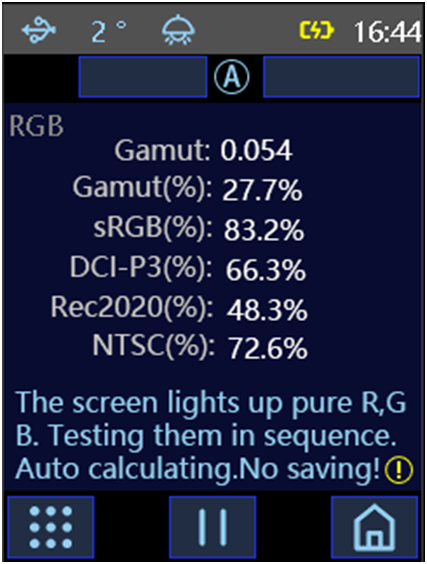
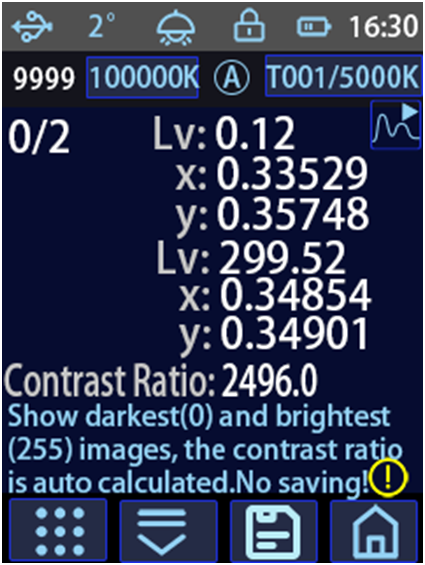
Figure 7
6. The measurement interface of the instrument can be locked to avoid misoperation.
7. The instrument is widely applied in LED lighting industry, engineering lighting, display screens, TV multimedia, and so on.
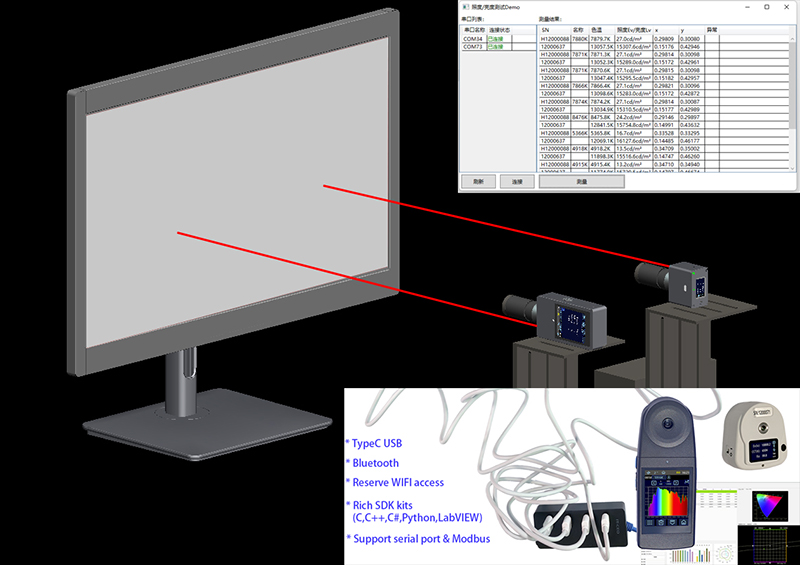
8. A computer can connect multiple instrument simultaneously via USB or Bluetooth for synchronous measurement and control.
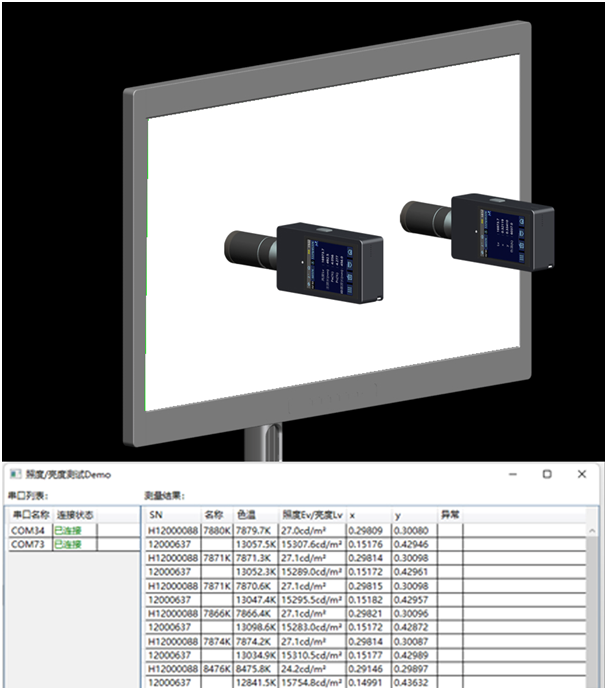
Figure 8
III Applications
3.1 Lv and chromaticity coordinates measurement of Display panel/LCD
In a darkroom environment, the display/LCD panel is powered on and warmed up for half an hour. The CI550 is fixed on a mounting fixture, ensuring its optical axis is perpendicular to the display surface, with the probe positioned approximately 30mm from the display surface (or the measurement port is pressed tightly against the screen). The display panel is controlled to show different colors, and the CI550 captures the Lv, chromaticity coordinates, and spectral radiance of the screen at a 1° measurement angle. Based on this data, the display's color gamut and uniformity can be calculated, and functions such as GAMMA/DICOM/color calibration can be performed.
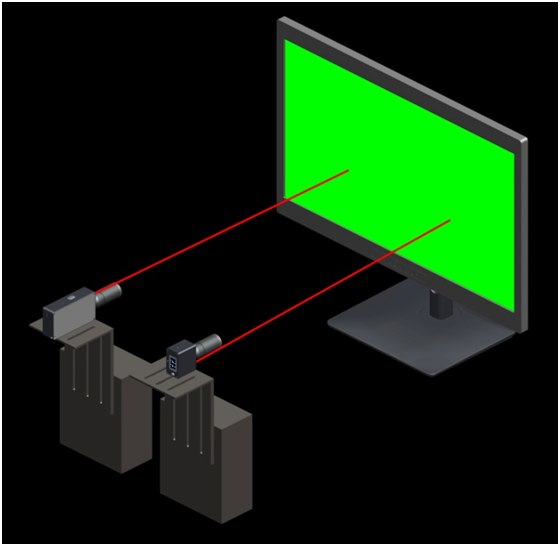
Figure 9
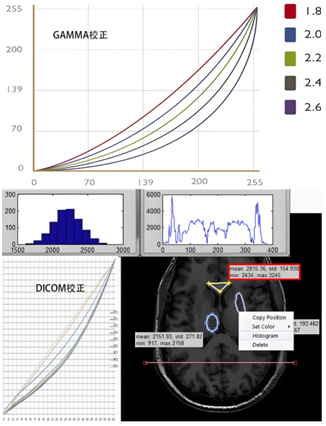
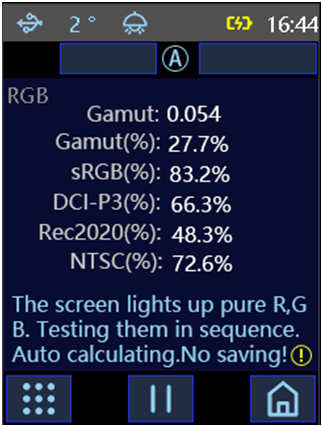
Figure 10
3.2 Measurement of color difference for LCD screens and panels
The commonly used luminance colorimeter can test the absolute luminance and coordinates xy of the screen. However, using absolute luminance and chromaticity coordinates cannot directly convert them into human visual color difference, which brings great difficulty to evaluating the color difference between screens.
Based on the human eye's adaptation characteristics to luminance color, combined with the widely used Δ E1976 color difference formula recommended by CIE, the instrument can easily test the color difference Δ E and Δuv of two screens based on the user's input of the screen's reference white point luminance, making it very convenient for users to use a luminance colorimeter for quality control of screen consistency.
The method for measuring the color difference between two screens using an instrument is as follows:
① Adjust the display parameters of the two screens, try to use the factory default parameters, and then adjust the luminance and reference white dots of the two screens to make them as consistent as possible. For example, adjust the luminance of both screens to 200cd/m ², and set the reference white to D65.
② Prepare a pure white image (RGB=255/255/255) to test the screen white point and multiple pure color images (such as 24 color cards or WRGBCMY color blocks) to evaluate color difference.
③ Display a pure white image (RGB=255/255/255) on one of the standard screens, preheat for about 5 minutes, test the brightness with an instrument, and input the luminance data to the reference white luminance of the instrument.
④ Then use two monitors to display solid color images for evaluating color difference.
⑤ Open the CI550 instrument, select the screen color difference as the color parameter, and then test the display color blocks of the two screens in sequence. The instrument automatically calculates Δ E76 and Δ UV.
⑥ Finally, use the average of multiple color differences to represent the color difference between the two monitors.
Normally, a 24 color chart is used to evaluate the average color difference between two displays. If the average Δ E76 is within 5.0, it indicates that the color difference between the two displays is acceptable. If the average Δ E76 is within 3.0, it indicates that the color difference between the two displays is relatively small.
Δuv, as the straight-line distance between two color coordinate points on the uniform color space CIE76UCS, can also represent the color difference between two colors to a certain extent.
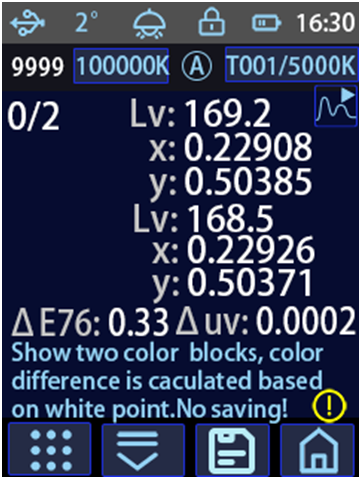
Figure 11
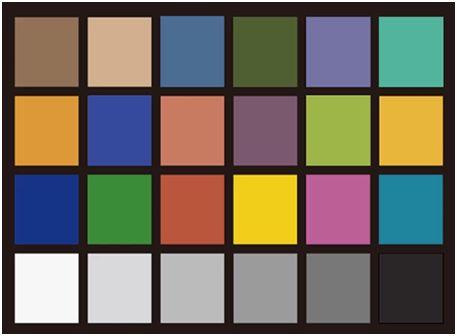
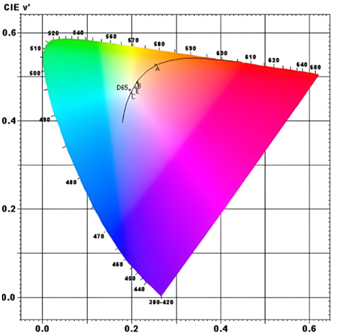
Figure 12
3.3 Measurement of flicker
Flicker is an unstable visual phenomenon caused by light stimuli that fluctuate in luminance over time. Flicker of lighting sources or screens can cause visual discomfort to the human eye and pose a threat to physical health. There are many parameter indicators for evaluating flicker, including flicker frequency, fluctuation depth, SVM, VESA, JEITA, RMS, and other indicators. CI550 can quickly capture luminance with a collection frequency of 1K, perform spectral analysis, and provide flicker, making it simple and convenient to use.
The method for measuring flicker using instruments is as follows:
① Try to increase the luminance of the lighting source or screen as much as possible, with a recommended brightness value of 500 cd/㎡ or higher. If it is a screen, it can display pure white images (RGB=255/255/255). Preheat for about 5 minutes to stabilize the light emission.
② Open the CI550 instrument and select the Flicker parameter.
③ Maintain the relative stability between the measuring probe and the light-emitting panel of the CI550 instrument, press the test button to perform the test, and the test results will be displayed on the touch screen for 3 seconds.
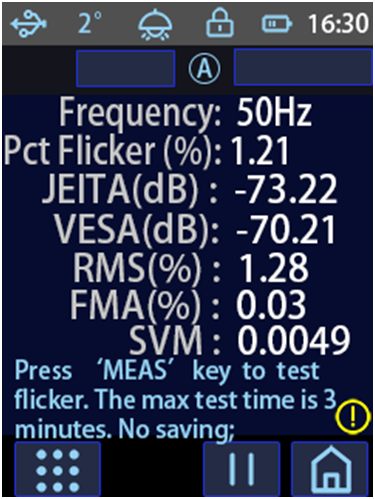
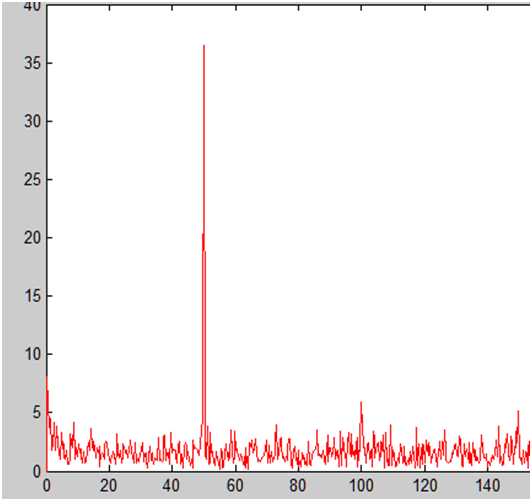
Figure 13
3.4Color temperature(CCT), Uniformity measurement of Light box or Display panel
The main technical indexes of the light box include the following: the standardization of the spectral distribution of the light source, the display uniformity of the illumination of the light source, the stability of the light source, the color temperature and color rendering index of the light source, and the life of the light source. The CI550 can easily measure the stability, uniformity and spectral matching of the light box.
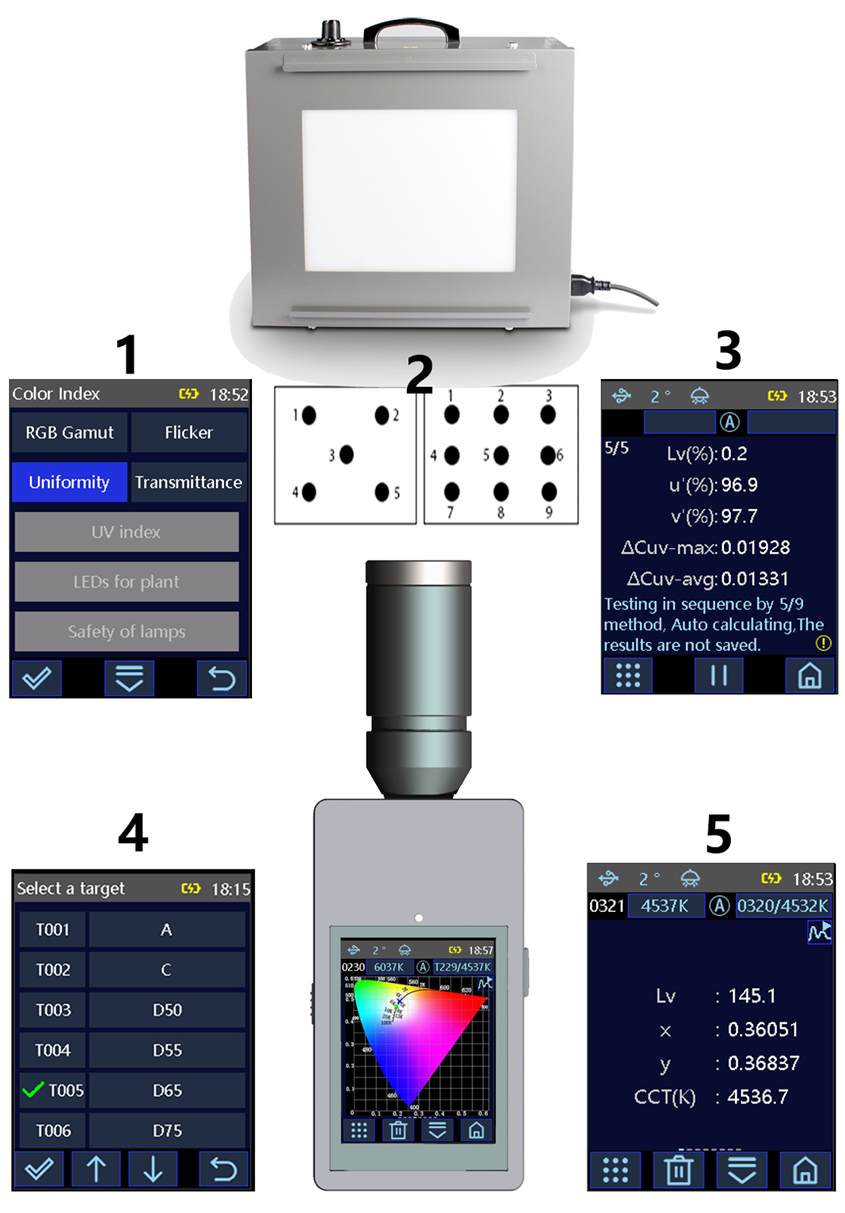
Figure 14
3.5 Transmittance Test
Transmittance is the ratio of the luminous flux (radiant flux) of light passing through the measured object to the incident luminous flux (radiant flux) . The transmittance of visible light is usually the ratio of the luminous flux of visible light at wavelengths of 380-780 nm, UVA transmissivity is usually the ratio of UVA to UVA radiation flux, and IR transmissivity is the ratio of IR radiation flux at wavelengths over 780 nm.
LED light source or halogen tungsten lamp is usually used as the lighting source in the transmissometer. From the test results, different lighting sources have a certain influence on the transmittance test results, usually affecting about 5% .
Many standards and documents clearly state that the D65 standard illuminator is the most ideal illuminator for transmissometers. The D65 standard lighting source is the Earth's average northern hemisphere solar spectrum, so the transmittance tested under this light source condition is very representative and easily accepted by the public. For example, outdoor glass, UV sunscreen glasses and other related standards clearly state that the D65 light source should be used for transmittance testing. HowLver, the light source used by the common transmittance meter is far from the D65 standard lighting source, so the test results are not very good.
CI550 can use outdoor sunlight (as close as possible to the D65 standard lighting source) as the lighting source, after two tests, very convenient test glasses, architectural glass in D65 standard lighting source under the condition of transmittance.
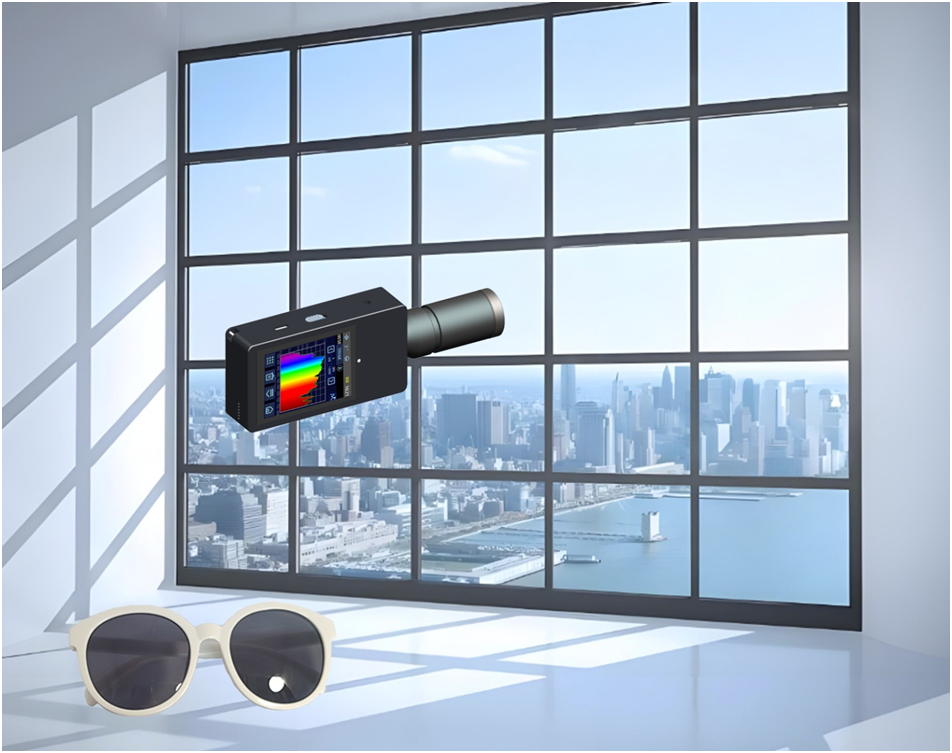
Figure 15
3.6 Reflectance Test
Reflectance refers to the ratio of the reflected luminous flux (or radiant flux) of an object to the incident luminous flux (or radiant flux). Visible light reflectance is typically the ratio of luminous flux within the wavelength range of 380~780 nm. UVA ultraviolet reflectance is usually the ratio of UVA ultraviolet radiant flux, while infrared (IR) transmittance is the ratio of infrared radiant flux with wavelengths exceeding 780 nm.
In a darkroom environment, the CI550 is fixed on a mounting fixture. A sample plate is placed at an appropriate distance directly in front of the probe, and the light source illuminates the center of the sample plate at a 45-degree angle from the normal of the sample plate. The light source can be a full-spectrum visible light source, such as a halogen tungsten lamp or a full-spectrum LED.
First, place a standard white board with a known reflectance (R_STD), and use the CI550 to measure the radiance spectrum of the standard white board, recorded as P_STD. Then, place the sample to be tested, and use the CI550 to measure the radiance spectrum of the sample, recorded as P_SAP. The reflectance of the sample can then be calculated as R = R_STD * (P_SAP / P_STD), from which the reflectance for visible light, ultraviolet, infrared, or each specific wavelength can be determined. Based on the reflectance and colorimetric knowledge, further calculations can be performed to obtain various parameters of the sample, such as tristimulus values (XYZ), chromaticity coordinates (xy), and Lab values.
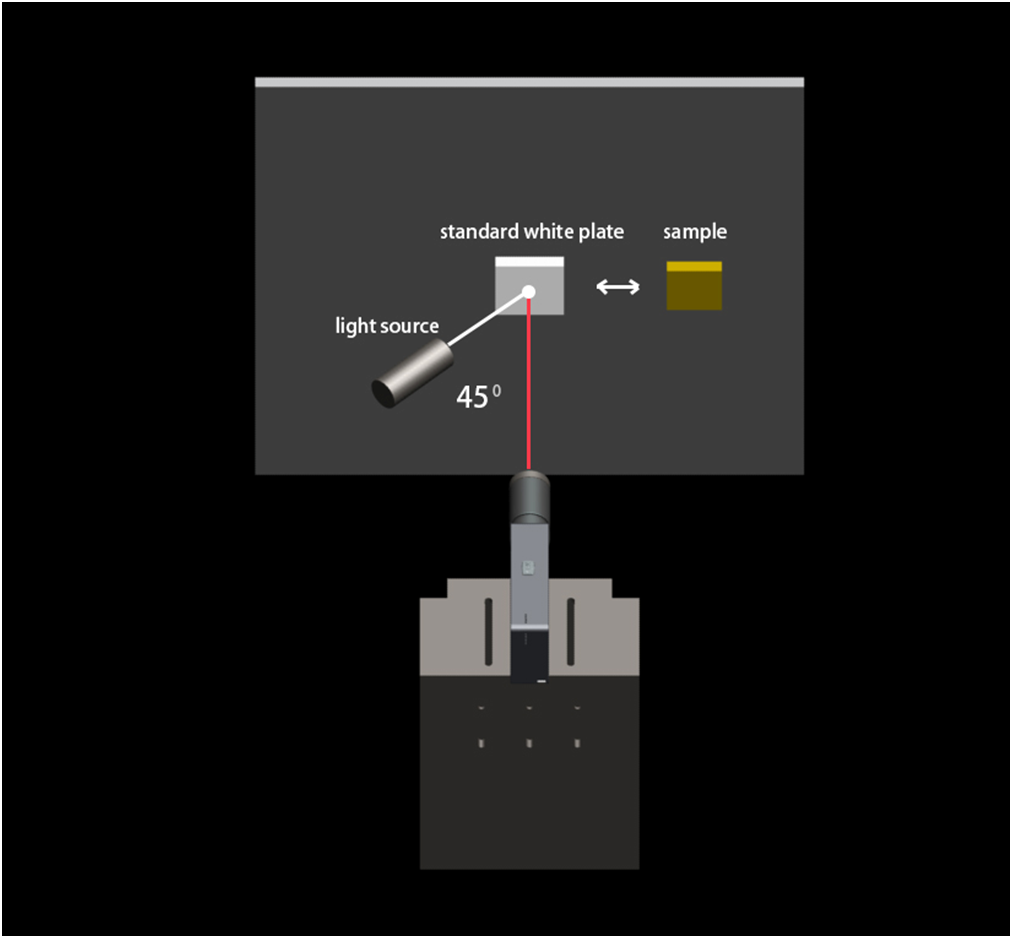
Figure 16
3.7 LED Synchronous Measurement of Chromaticity Coordinates, Color Gamut, and Brightness for LED Outdoor Advertising Screens
Large-sized LED displays or LCD screens are typically composed of smaller display modules. Due to differences in these small-sized display modules and their driving modules, the consistency and uniformity of the assembled large display screen may deteriorate. In such cases, it is necessary to adapt the driving circuits and color gamut mapping according to the display characteristics of different modules to ensure uniform performance of the assembled large display.
Multiple CI550 units can be fixed at the center of each small-sized display module. The host computer uses specialized synchronous testing software to control multiple CI550 units via USB cables or Bluetooth for synchronized testing. The host computer directs the display to show different colors and controls the CI550 units to collect photometric data. Subsequently, the display parameters of each small-sized module are characterized, and individualized adaptations are performed. This ensures that the assembled large display achieves consistent and uniform performance.
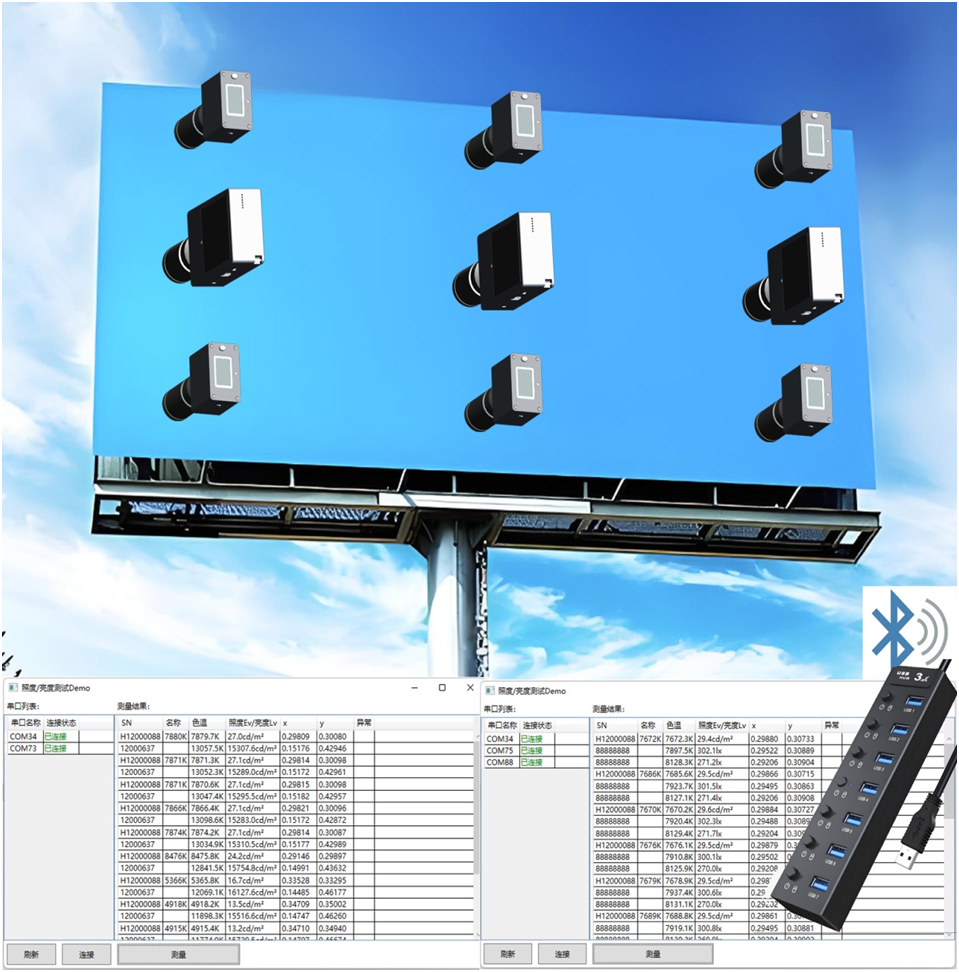
Figure 17
IV Dimensions
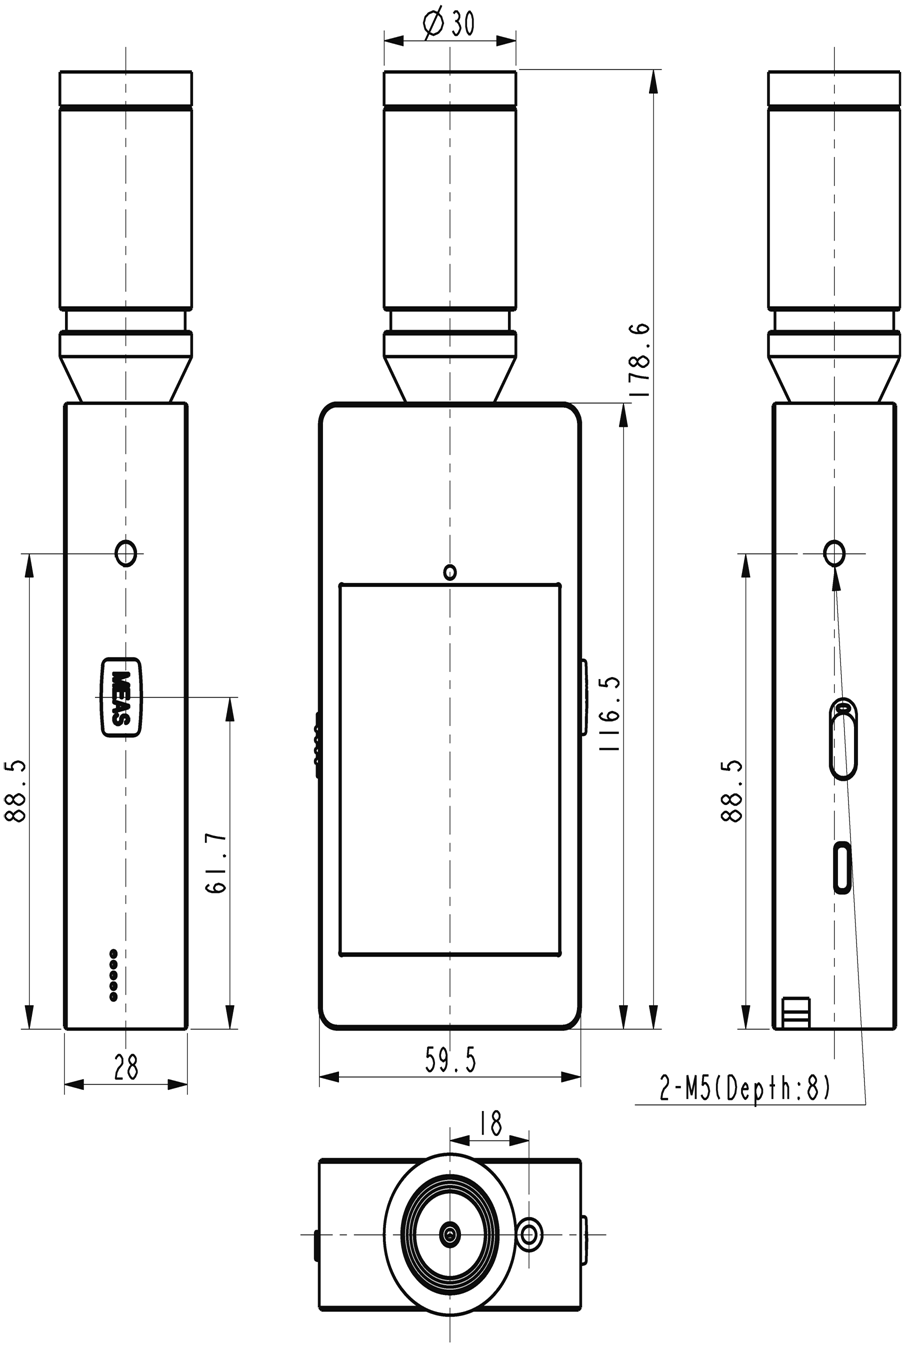
Figure 18
V Technical Parameter
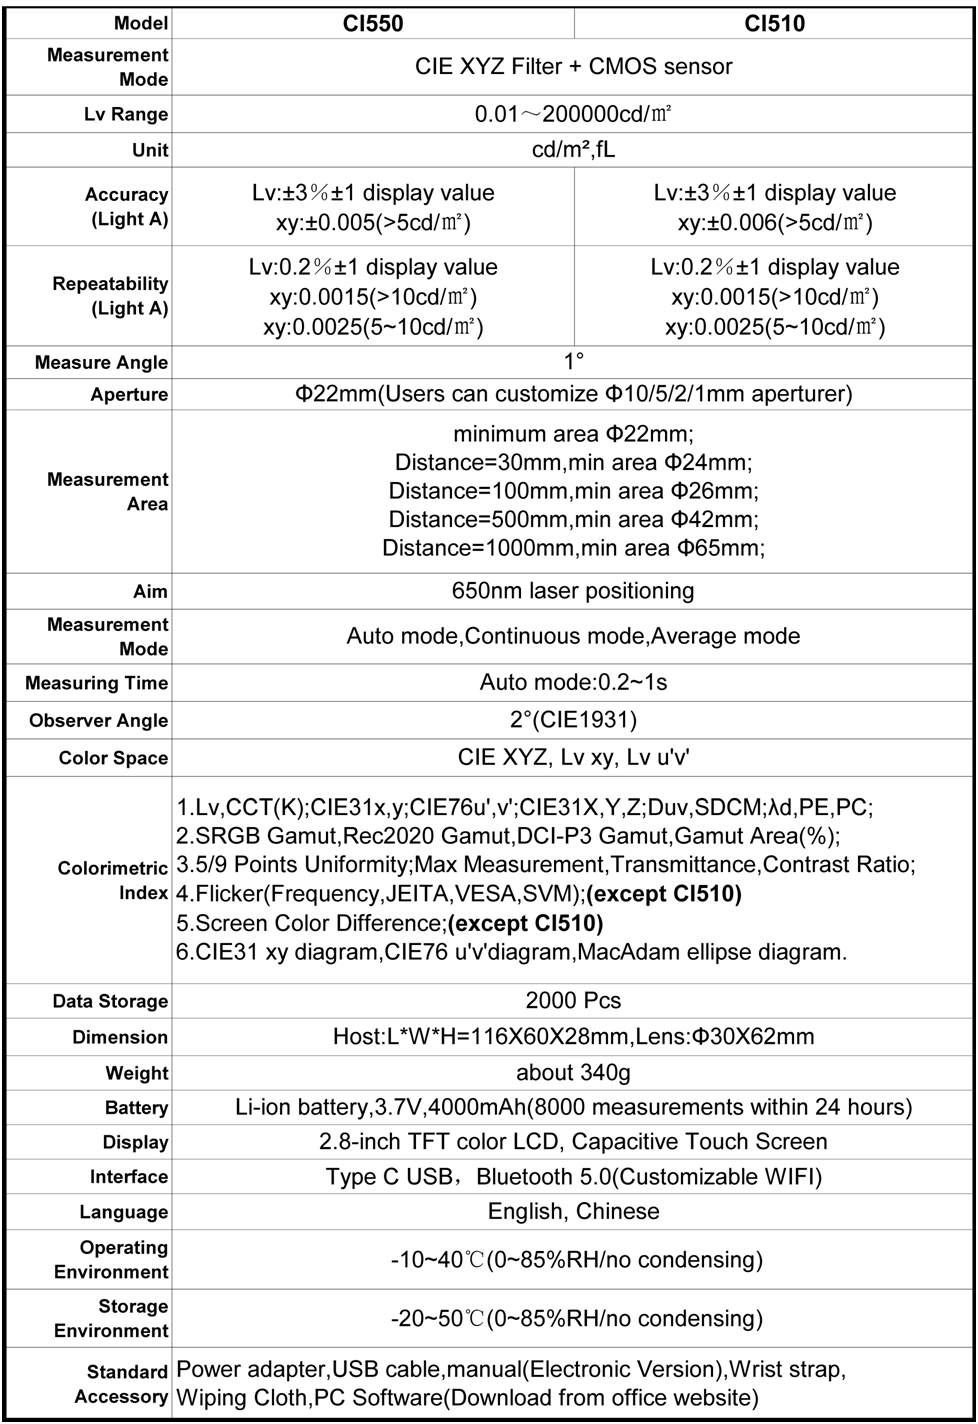
Figure 19