

Category
Recommended Products
CI503P COLOR ANALYZER
CI550 COLOR ANALYZER
CL138 UV light meter
CI510 COLOR ANALYZER
CL503 illuminance colorimeter
CI300 Color Analyzer
CL300 illuminance colorimeter
CI820 SPECTRAL LUMINANCE COLORIMETER
CL320 UV Meter
CI350 LUMINANCE COLORIMETER
Contact Us
E-mail:info@huicolor.com
Tel:0086 755 2317 9385
Mobile:0086 135 0006 9487
Technical Articles
Display screen/LCD/OLED Color Difference Measurement
- Time:2026-09-13
- Visits:1
Display screen Color Difference Measurement
1 Overview of Screen Color Difference Measurement
The luminance(Lv), color temperature, and reference white point of displays or LCD panels are typically adjustable. The same image displayed under different reference white point conditions will show significant differences when measured with a luminance colorimeter for luminance and chromaticity coordinates. For example, the same image appears relatively more yellowish under a D50 reference white point compared to D65.
Human color adaptation is a physiological process in which the visual system automatically adjusts to changes in the color of ambient illumination, ultimately maintaining relative stability in the perceived color of objects. For example, the same image displayed at 200 cd/m² and 400 cd/m² with a D65 white point will appear identical to the human eye after full color adaptation, yet a luminance colorimeter will clearly detect the luminance difference.
Conventional luminance colorimeters can measure the absolute luminance(Lv) and chromaticity coordinates xy of a display. However, absolute luminance and chromaticity coordinates cannot be directly converted into human-perceived color difference, which creates significant difficulty in evaluating color differences between displays.
How to effectively and conveniently control the authenticity of displayed colors and the color difference between different screens is a critical subject for QC engineers. We can use a luminance colorimeter to collect absolute luminance and absolute chromaticity coordinates, then convert them into human-eye-adapted chromaticity data in a perceptually uniform color space. Finally, we use established color difference formulas to express the color difference between two displays and further perform color calibration.
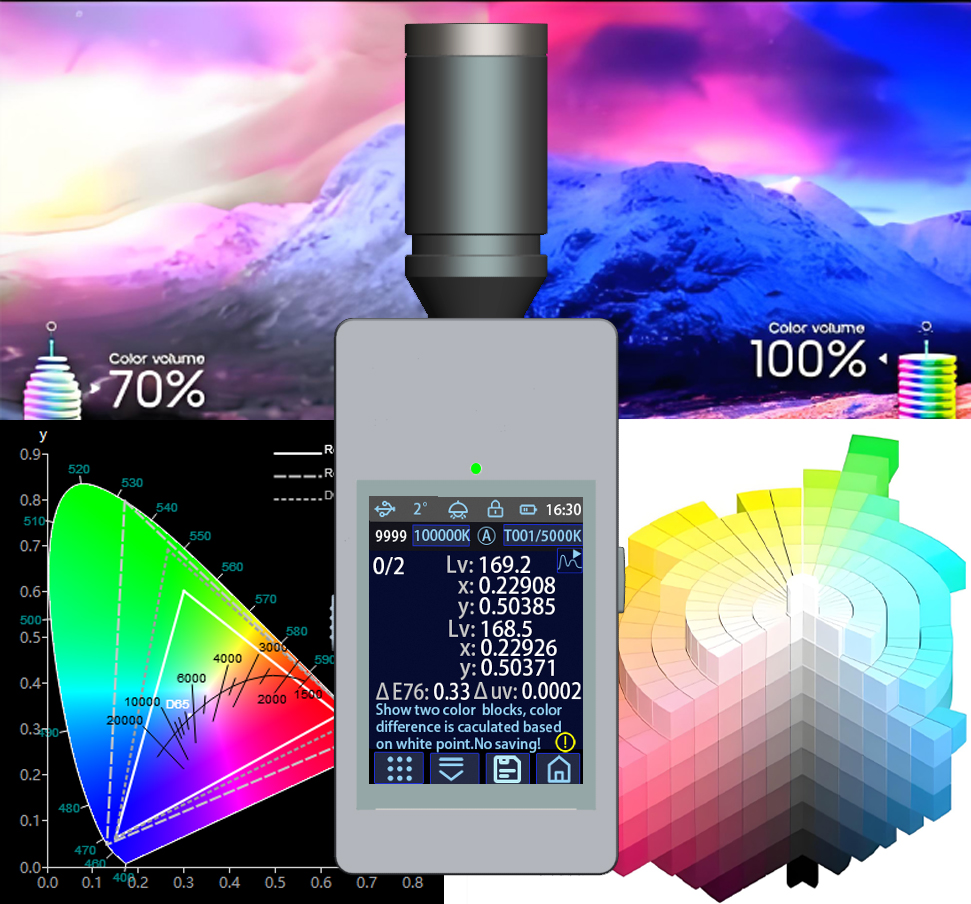
The CI550 Color Analyzer can measure technical parameters such as luminance, chromaticity coordinates, color temperature, and dominant wavelength of displays and light sources. It can also test screen color difference, flicker, RGB color gamut, screen contrast, and uniformity. Equipped with a 2.8-inch capacitive touchscreen, the instrument can operate standalone or be connected to a computer, offering convenient operation and simple measurement.
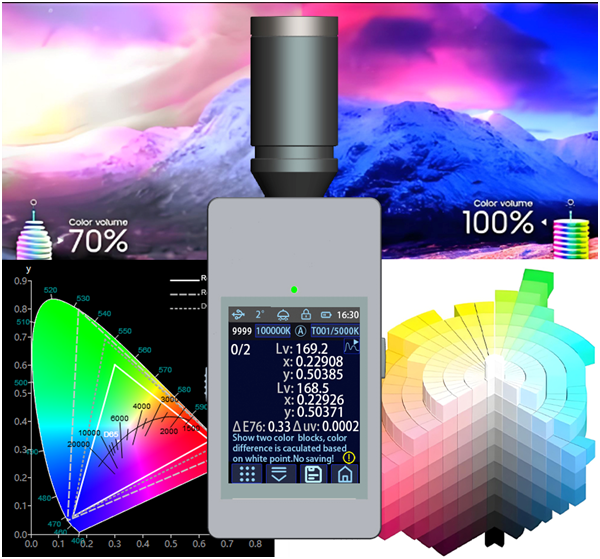
Figure 1
2 CIE Color Space and color-difference formula
2.1 Human visual color adaptation
Human visual color adaptation is a physiological process in which the visual system automatically adjusts color perception in response to changes in ambient light color, ultimately maintaining relative stability in the perceived color of objects.
Light adaptation: When moving from a dark environment to a bright one, visual sensitivity decreases rapidly, and color details become visible within seconds to minutes. This adjustment is primarily mediated by cone cells.
Dark adaptation: When moving from a bright environment to a dark one, visual sensitivity to low light gradually increases. The complete process takes 20–30 minutes, is primarily mediated by rod cells, and depends on the synthesis and recovery of rhodopsin.
Human visual color adaptation is an automatic visual regulatory process that maintains color constancy, and it directly alters our subjective judgment of display color differences — a factor that cannot be ignored in color difference calculation and calibration. Regarding ambient light adaptation bias: when ambient illuminance increases from 50 lux to 500 lux, human sensitivity to blue tones decreases by approximately 15%, while sensitivity to yellow tones increases. It is recommended to adjust ambient illuminance to approximately 300 lux when visually evaluating screen color differences, and to align the color temperature with the display's reference white point as closely as possible.
2.2 CIE Yxy Color Space
The International Commission on Illumination (CIE), based on collective visual experiments, first established the CIE 1931-RGB real trichromatic color system, and later developed the improved CIE 1931 XYZ chromaticity system, where X represents the red primary, Y the green primary, and Z the blue primary.
CIE XYZ and CIE Yxy are fundamental color spaces in colorimetry, and major display-related standards utilize Yxy color coordinates. All colors can find corresponding coordinates within the CIE XYZ and Yxy color spaces. However, the distance between two points in these spaces does not correspond proportionally to perceived visual difference,meaning CIE XYZ and Yxy are perceptually non-uniform.
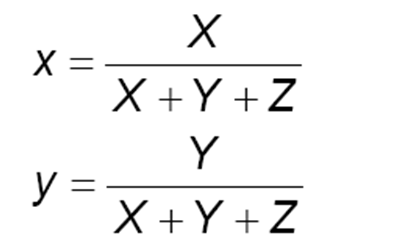
Figure 2 xy Formula
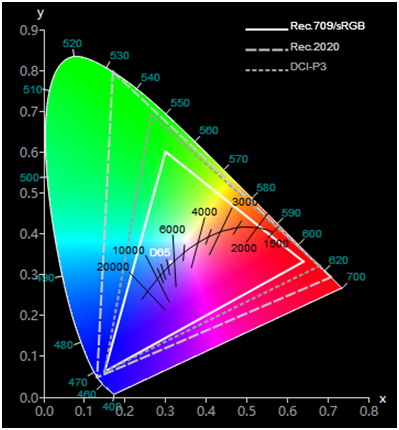
Figure 3 xy Chromaticity Diagram
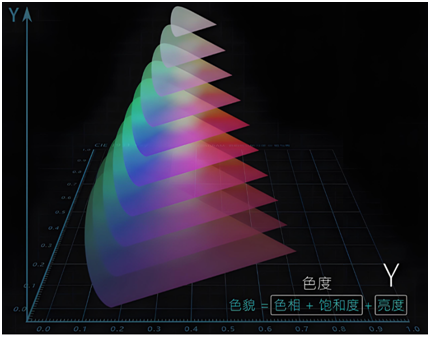
Figure 4 Yxy Cube
2.3 CIE 76 Color Space and ΔE76 Color Difference Formula
In 1976, the CIE recommended the CIE 1976 L*a*b* (CIELAB) and CIE 1976 L*u*v* uniform color spaces. All colors can be represented by coordinates in these spaces, and the distance between two coordinate points corresponds proportionally to perceived visual difference, providing a foundation for unified color difference evaluation.
CIELAB expresses color in three dimensions: L* represents lightness (0–100), the a* axis represents the red–green axis (positive values indicate red, negative values indicate green), and the b* axis represents the yellow–blue axis, as shown in Figure 5.
CIE 1976 UCS was improved from CIE Yxy, defining chromaticity coordinates through the rectangular coordinate system v' and u', as shown in Figure 6.
The ΔE76 color difference formula for uniform color spaces is shown in Figure 7.
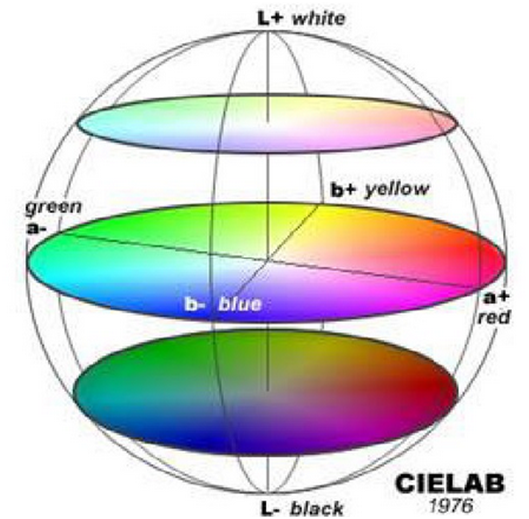
Figure 5 CIELAB cube
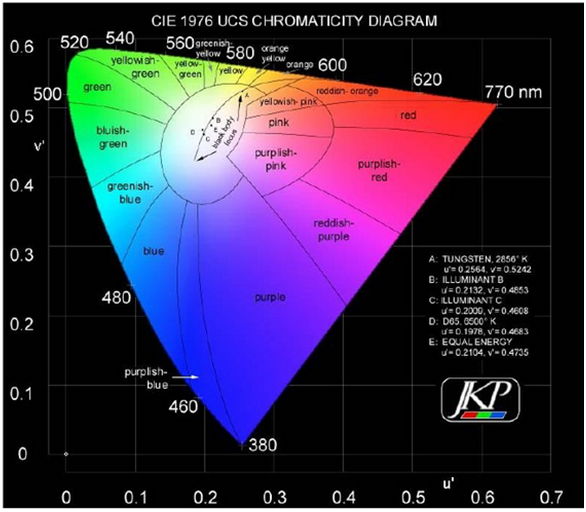
Figure 6 CIE 1976 UCS

Figure 7ΔE76 Color Difference Formula
2.4 Measurement principle and method of screen color difference
① Warm up the display or luminous panel for at least 10 minutes, then use a luminance colorimeter to collect absolute luminance and chromaticity coordinates.
② Under the reference white point condition, convert the absolute luminance and chromaticity coordinates collected by the luminance colorimeter into luminance and chromaticity coordinates after human visual color adaptation.
③ Convert the luminance and chromaticity coordinates after human color adaptation into corresponding coordinate points in the CIE 1976 Lab and CIE 1976 UCS color spaces.
④ Calculate the color difference using the ΔE76 formula and Δuv.
When ΔE76 ≤ 3.0, only professionally trained personnel can distinguish the color difference; ordinary users will not perceive color deviation in daily use.
Typically, when evaluating the average color difference between two displays using a 24-color chart, an average ΔE76 within 5.0 indicates acceptable color difference between the two displays, while an average ΔE76 within 3.0 indicates relatively small color difference.
In multi-screen collaborative scenarios, it is recommended to control the color coordinate deviation of all screens and luminous panels (with reference white point set to D65 and default luminance) within ΔE ≤ 3 to ensure multi-screen color consistency.
Δuv, as the straight-line distance between two color coordinate points in the uniform color space CIE 76 UCS, can also represent the color difference between two colors to a certain extent.
3 Screen Color Difference Testing with the CI550 Colorimeter
3.1 Principle of CI550 Colorimeter Color Difference Measurement
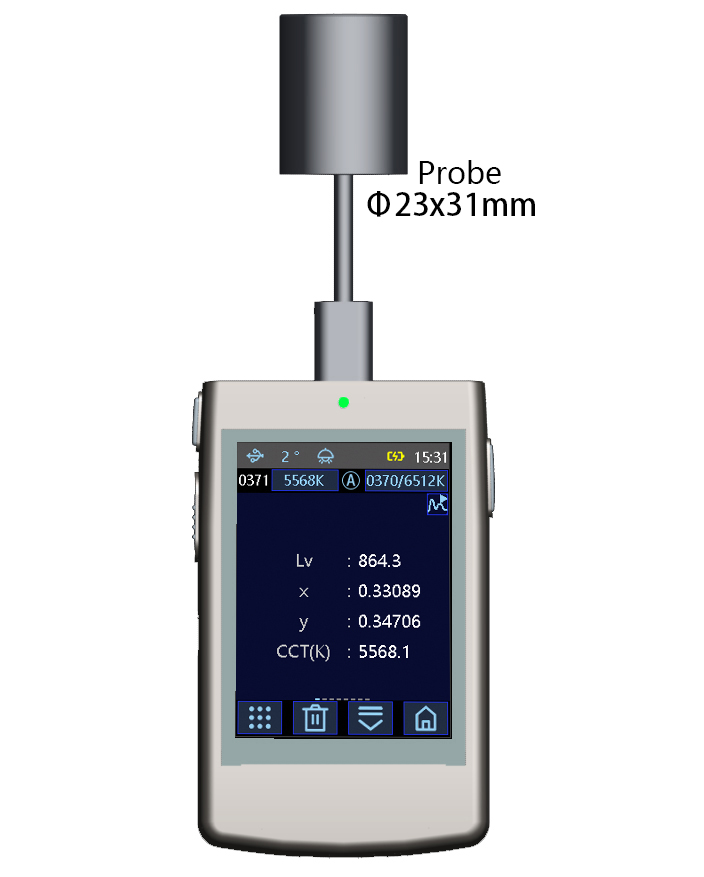
The CI550 Color Analyzer is a portable color analyzer produced by Huicolor. The instrument uses XYZ filters combined with a CMOS detector to collect the tristimulus values XYZ of the light source, and further calculates the luminance and chromaticity coordinates. The instrument features a 1° measurement angle, a minimum measurement area of Φ22 mm (Φ10 mm aperture optional), and a maximum measurement range of up to 200,000 cd/m². It is equipped with a 2.8-inch TFT capacitive touchscreen, a 4000 mAh lithium-ion battery, Bluetooth/Wi-Fi multifunction chip, and large-capacity memory.
The instrument can measure not only technical parameters such as luminance, chromaticity coordinates, color temperature, and dominant wavelength of light sources and displays, but also screen color difference, flicker, RGB color gamut, panel uniformity, and contrast. It supports multiple measurement modes including single measurement, average measurement, and continuous measurement; it can operate standalone or be connected to a computer, offering high cost-effectiveness and wide application.
The CI550 Color Analyzer uses ΔE and Δuv to evaluate screen color difference, and is easy to operate.
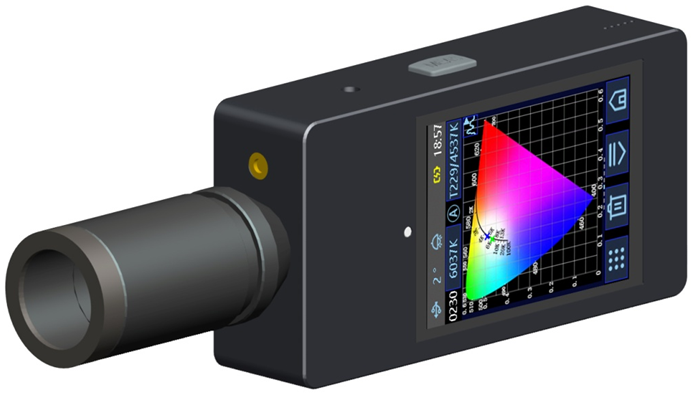
Figure 8 CI550
3.2 Procedure of Color Difference Measurement by CI550 Colorimeter
The method for measuring the color difference between two screens using an instrument is as follows:
① Adjust the display parameters of the two screens, try to use the factory default parameters, and then adjust the luminance and reference white dots of the two screens to make them as consistent as possible. For example, adjust the luminance of both screens to 200cd/m ², and set the reference white to D65.
② Prepare a pure white image (RGB=255/255/255) to test the screen white point and multiple pure color images (such as 24 color cards or WRGBCMY color blocks) to evaluate color difference.
③ Display a pure white image (RGB=255/255/255) on one of the standard screens, preheat for about 5 minutes, test the luminance with an instrument, and input the luminance data to the reference white luminance of the instrument.
④ Then use two monitors to display solid color images for evaluating color difference.
⑤ Open the CI550 instrument, select the screen color difference, and then test the display color blocks of the two screens in sequence. The instrument automatically calculates Δ E76 and Δ UV.
⑥ Finally, use the average of multiple color differences to represent the color difference between the two monitors.
Normally, a 24 color chart is used to evaluate the average color difference between two displays. If the average Δ E76 is within 5.0, it indicates that the color difference between the two displays is acceptable. If the average Δ E76 is within 3.0, it indicates that the color difference between the two displays is relatively small.
Δuv, as the straight-line distance between two color coordinate points on the uniform color space CIE76UCS, can also represent the color difference between two colors to a certain extent.
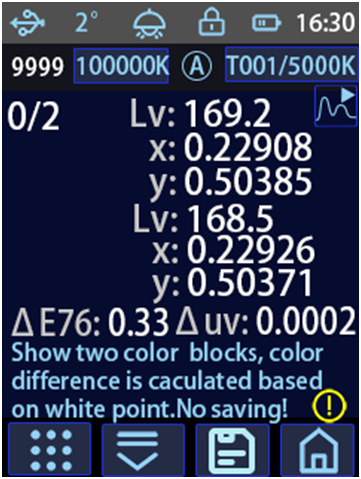
Figure 9 CI550 Color Difference Test Interface
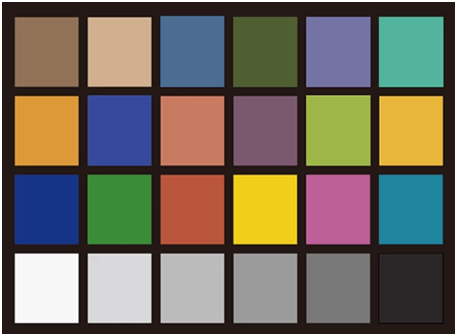
Figure 10 24-Color Chart
3.3 Advantages of the CI550 Colorimeter for Color Difference Measurement
① The measurement principle and method are consistent with those used by leading screen and luminous panel manufacturers in the industry, ensuring good data compatibility.
② Simple operation and convenient use, screen color difference measurement can be completed by tapping the touch screen and pressing the measurement button.
③ The instrument supports HCAL secondary calibration, and the manufacturer provides complete color calibration / DICOM / GAMMA technical solutions.
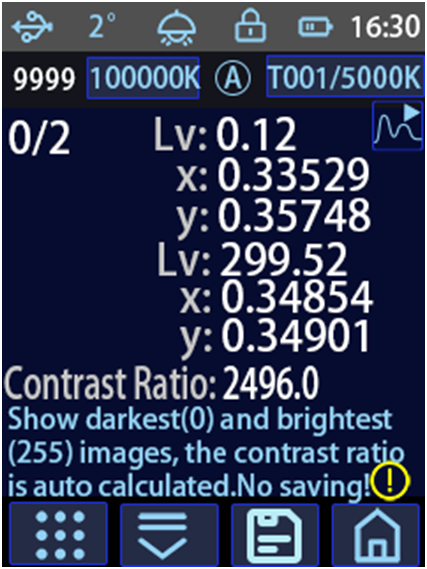
Figure 11 CI550 Contrast Measurement Interface
3.4 Accuracy of the CI550 Luminance Colorimeter
Many characterization parameters of displays, LCD panels, and luminous panels, such as luminance, chromaticity coordinates, color temperature, contrast, flicker, luminous uniformity, grayscale response, and viewing angle,can be accurately measured with the CI550 luminance colorimeter.
The CI550 luminance colorimeter supports PC-based HIQC color management software for color data management, such as saving project data and printing reports. The instrument comes with a comprehensive SDK development package that supports secondary development.
The PC-based HMST synchronous test software can connect multiple CI550 luminance colorimeters for synchronous data acquisition.
The PC-based HCAL calibration software can perform secondary calibration on the CI550 luminance colorimeter, bringing the measured data closer to the CS2000 target instrument.
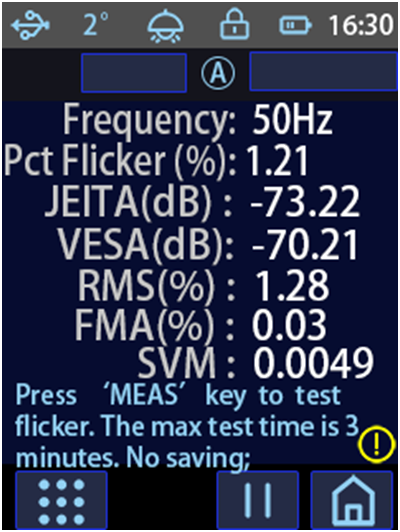
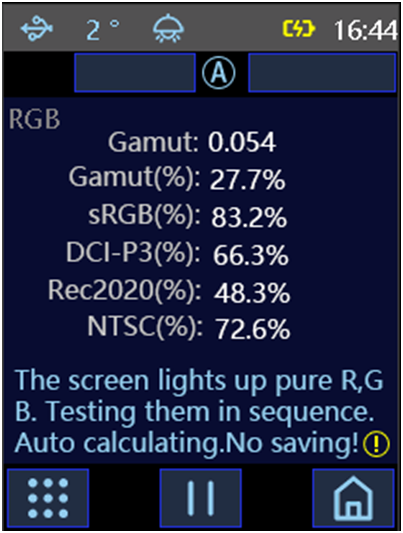
Figure 12 CI550 Flicker and RGB Gamut Measurement Interfaces
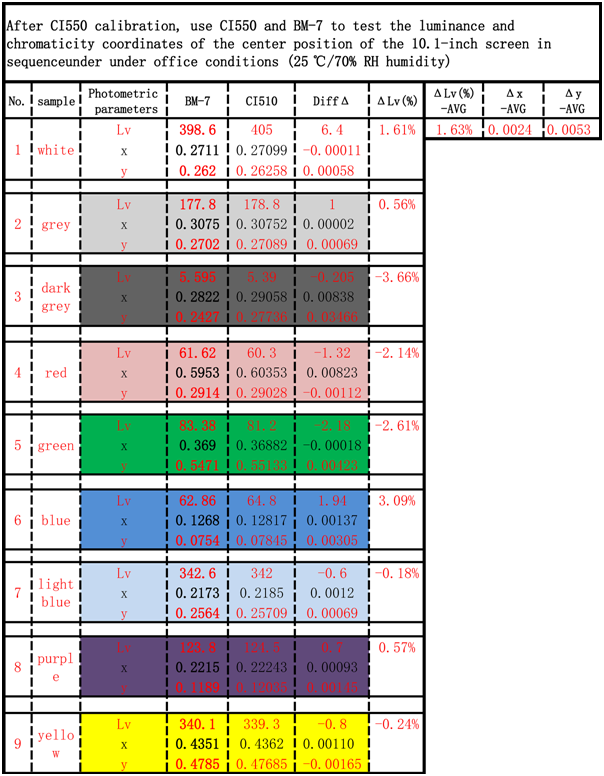
Figure 13 CI550 VS B*-7
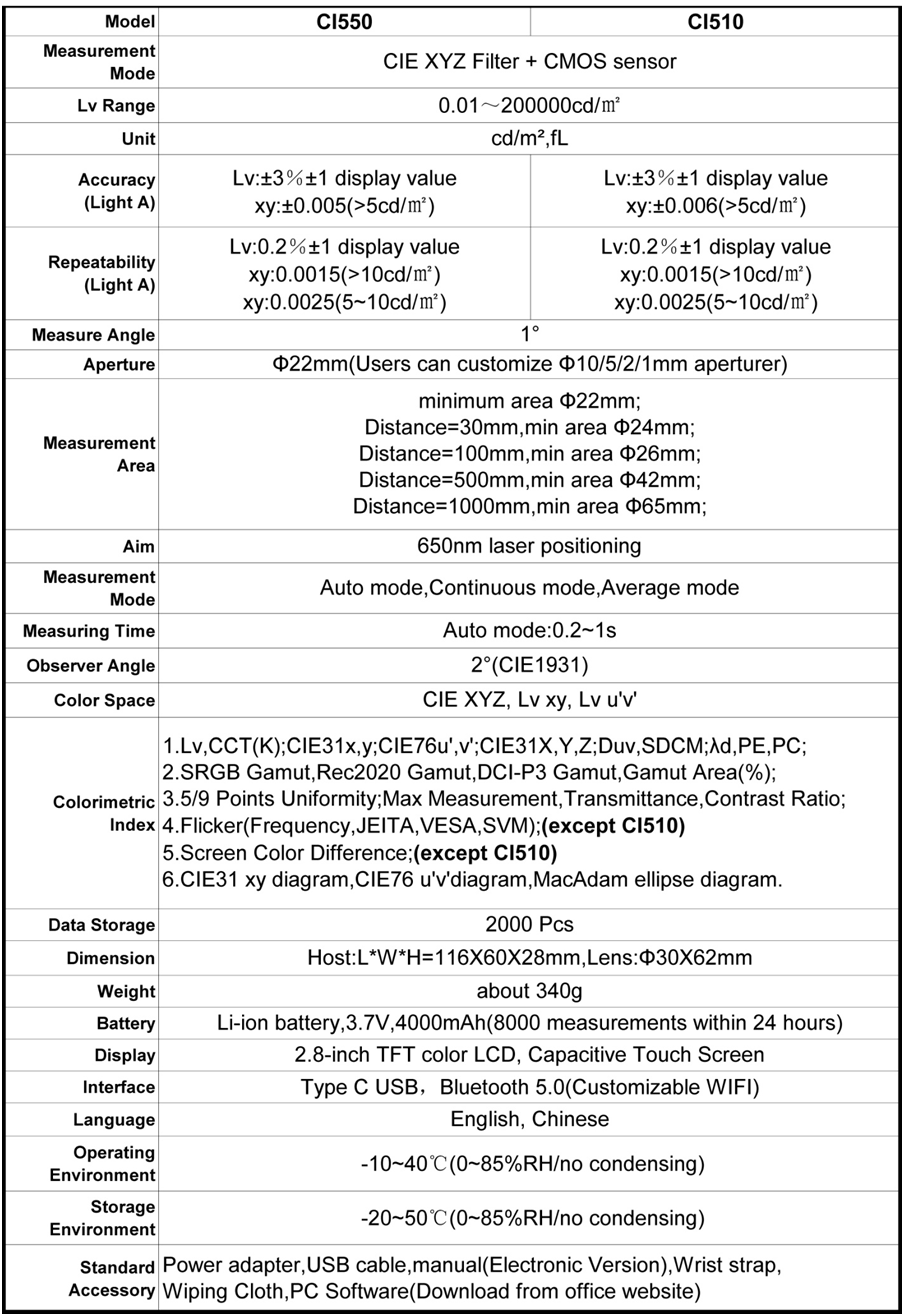
4 Technical Parameter of CI550 Colorimeter